13 May 2016
By Maynard Paton
Today I’m reviewing one of my recent share investments.
The company in question is Daejan (DJAN), which you may recall I added to my watch list last year.
After monitoring the group’s subsequent progress, I decided to buy at an average price of £58 (including all costs) between November 2015 and March 2016. The share price now is £57 and the holding currently represents about 5% of my portfolio.
I have to confess, this new position is not terribly exciting. DJAN is a low-profile business that owns a variety of commercial and residential buildings located mainly in London and the eastern United States.
Nonetheless, I do feel this £929m firm offers many traits of a respectable investment.
Important attractions for me include an impressive record of dividend and net asset growth, a conservatively financed balance sheet, a boardroom staffed by veteran family management, and a modest share-price valuation.
However, I recognise DJAN is by no means a one-way bet.
An obvious danger here is a dependence on what could be a toppy property market. Another potential drawback is that the shares have always appeared ‘cheap’ — due mostly to the directors’ 80% family shareholding and their reticence towards outside investors.
At A Glance
* Residential and commercial property landlord
* Illustrious history showcases regular dividend and asset growth
* Risk-averse executives have £743m riding on the share price
* Shares priced at 0.67 of book value
Buildings in Holborn, Hampstead, Kensington and beyond
Daejan (DJAN) can trace its property history back to the 1950s when the firm’s founder, Osias Freshwater, started buying residential buildings in London.
During 1959, Mr Freshwater reversed his property assets into a quoted cash shell called Daejan Samoedra Estates, which previously owned rubber and coffee plantations in Indonesia.
Further residential properties — many of which consisted of regulated tenancies — were purchased alongside various commercial property acquisitions during the 1960s. By the late 1970s, DJAN had started to buy apartment blocks in the United States.
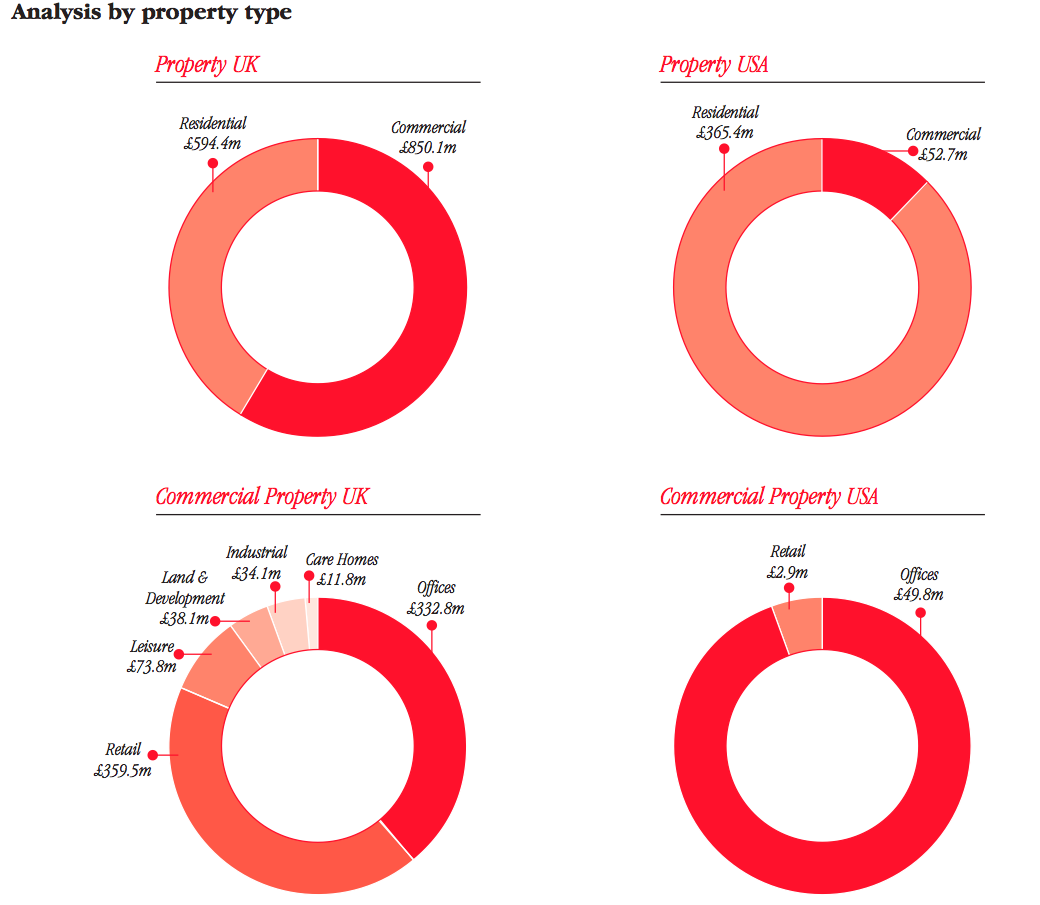
These days the group owns property with a near-£2bn valuation and the pie charts below show that UK commercial property represented 46% and UK residential property represented 32% of the entire estate as at March 2015.
Meanwhile, US residential property represented 20% and US commercial property represented 3%:
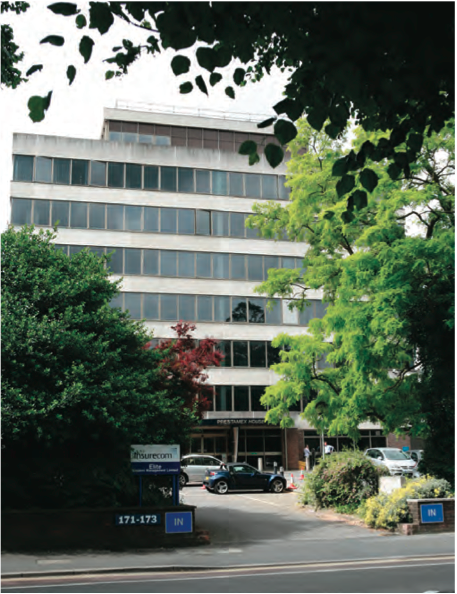
The following snapshots give you a taste of DJAN’s buildings in London.
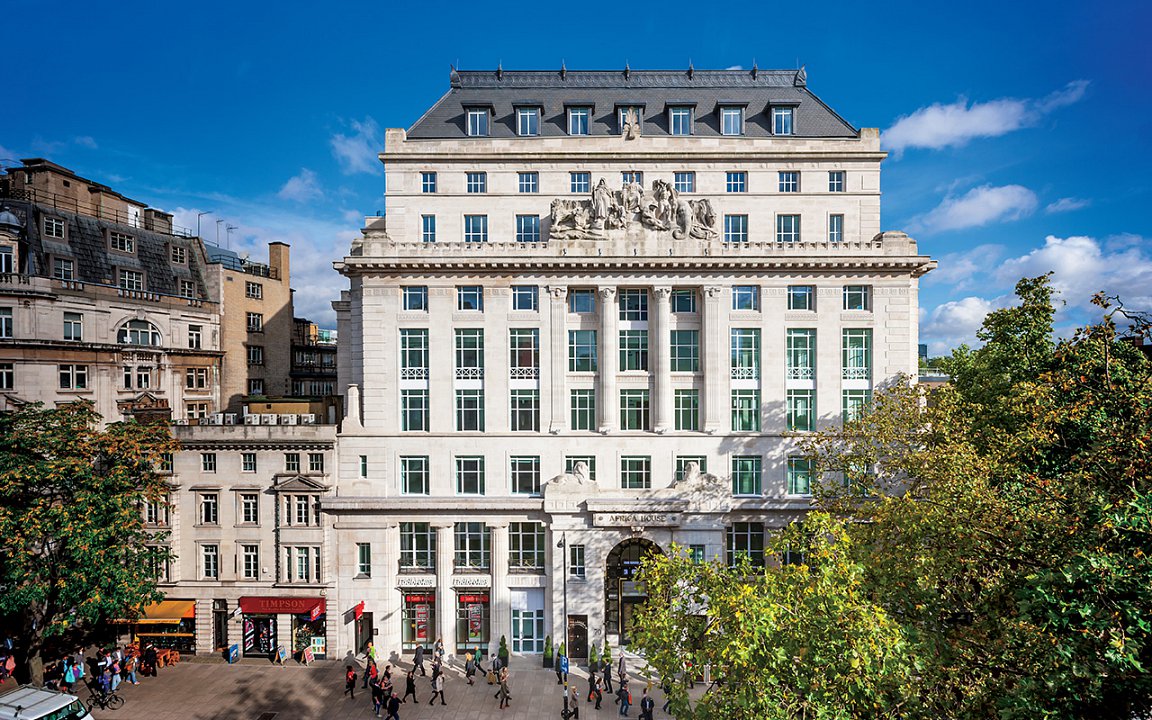
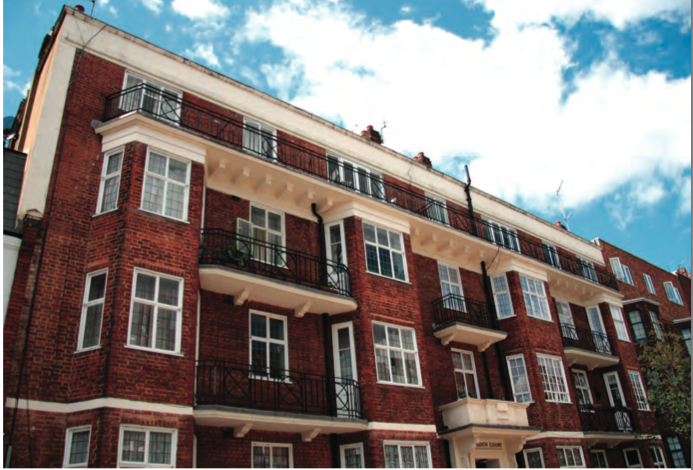
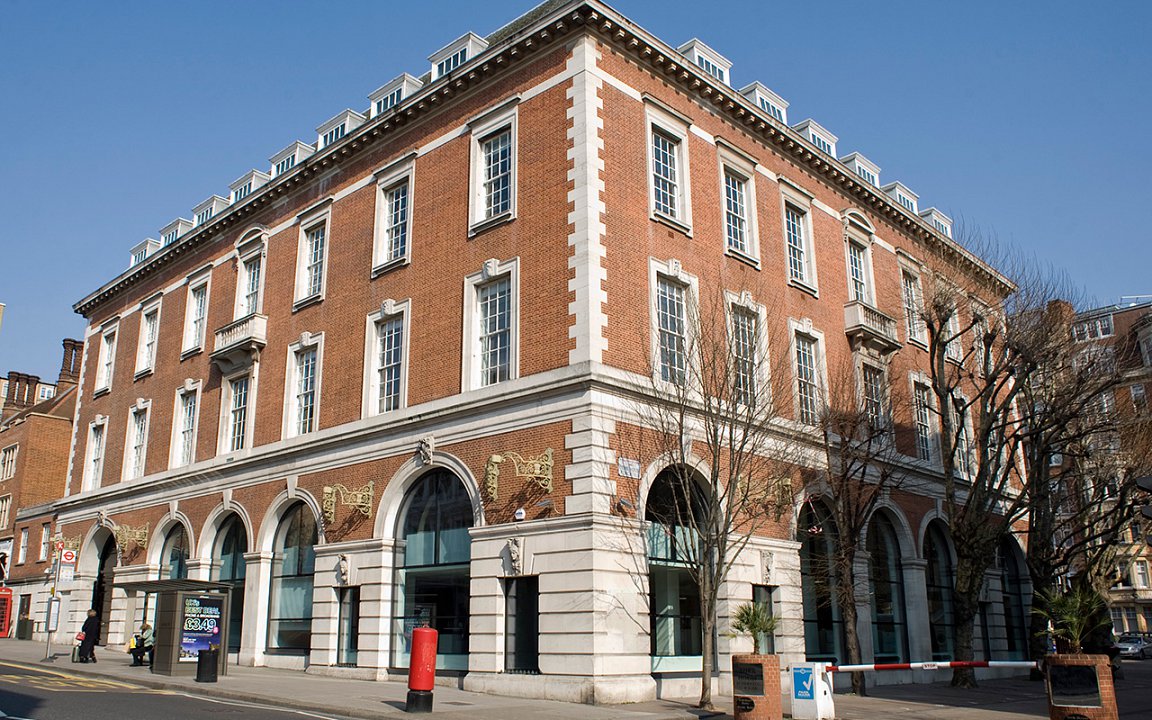
The first picture shows Africa House, which is located in Holborn and is one of the group’s most valuable properties. The second picture shows DJAN’s residential flats in West Hampstead, while the third shows a site owned in Kensington:
The group’s portfolio does cover more everyday locations, though. The following pictures show DJAN’s shopping centre in Dartford, Kent, and some of its offices in Brighton, East Sussex:

More pictures of DJAN’s properties can be found on the group’s website, www.daejanholdings.com.
One of the market’s most remarkable and durable financial histories
Plenty of property snapshots can also be found within DJAN’s annual reports, which stretch all the way back to 1980 via Companies House. Skim through the archives and you’ll soon discover one of the market’s most remarkable and durable financial histories.
Indeed, a snippet from the 2009 annual report confirms DJAN owned property assets of £4m and sported a book value of 29p per share when the group floated in 1959: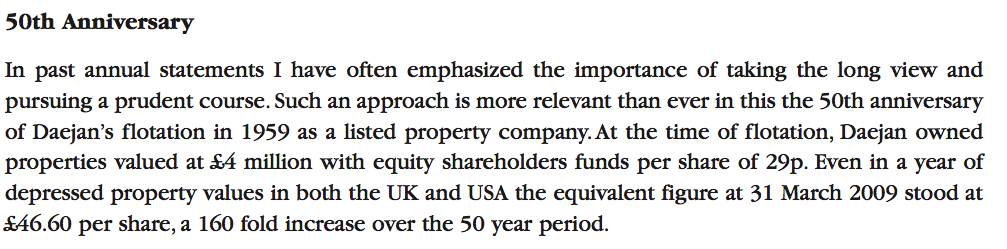
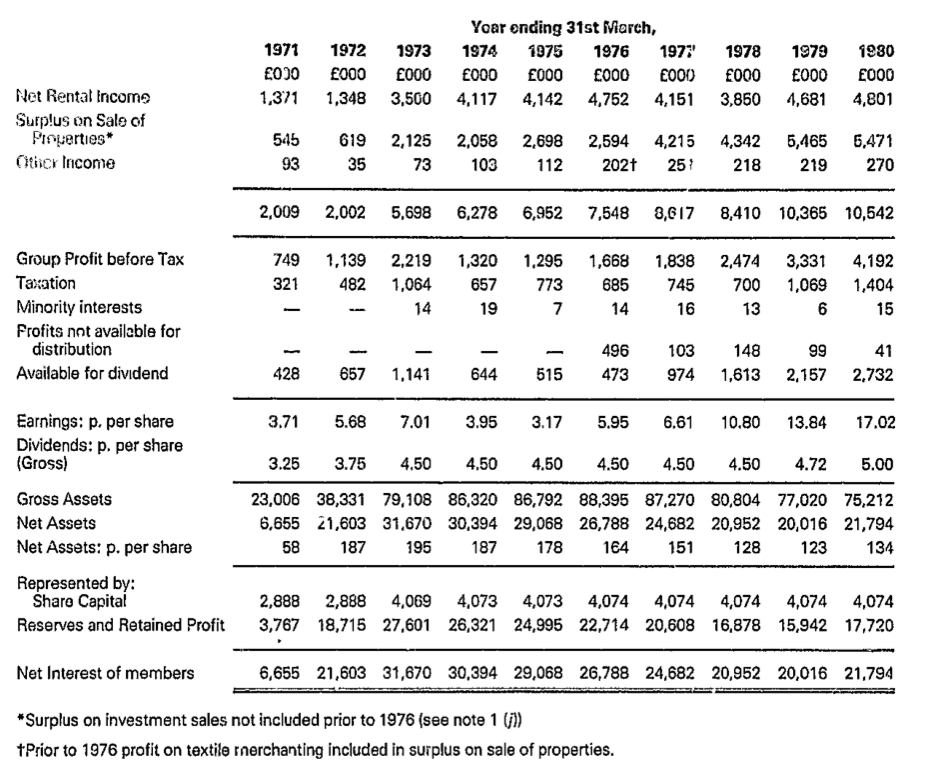
Open up the 1980 annual report and you’ll then see DJAN’s net asset value (NAV) having advanced to 58p per share by 1971 and to 134p per share by 1980:
At the time of the 2015 report, DJAN’s NAV had reached £1,334m — equivalent to £82 per share — and up 282-fold since the 1959 flotation. Book value going from 29p to £82 per share in 56 years equates to a compound average gain of 10.6% per annum.
The table below summaries the group’s last five years:
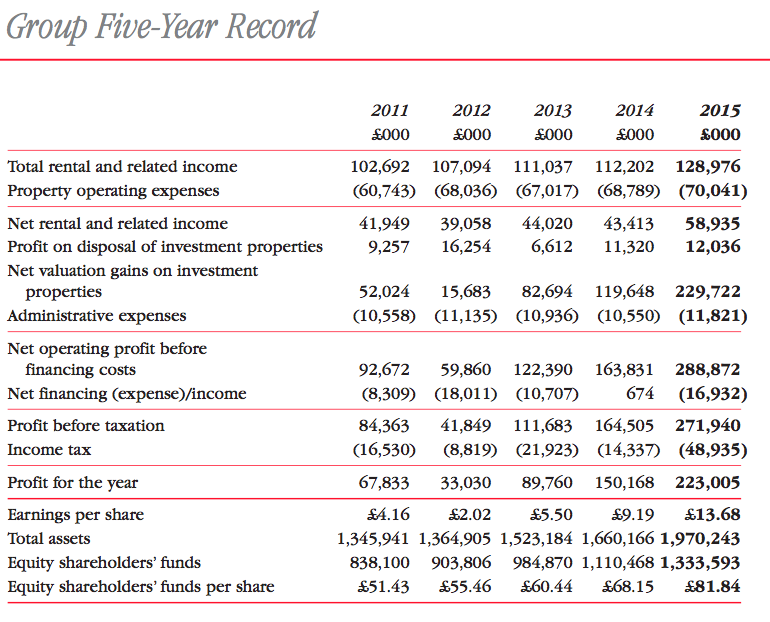
DJAN’s growth rate during recent years has generally been modest, with improvements to the group’s rental income and profit lagging behind the rising asset valuation:
| 2010 to 2015 | 2005 to 2015 | 2000 to 2015 | |
| Rental income CAGR | 5.2% | 3.4% | 4.7% |
| Operating profit CAGR | 6.8% | 3.8% | 3.2% |
| Dividend per share CAGR | 3.5% | 3.4% | 4.4% |
| Net asset value CAGR | 11.2% | 7.7% | 9.2% |
Although DJAN’s long-term progress has been positive, the track record has not been entirely without setback.
The archives show the group’s NAV dropping 16% during the 2008/9 financial crisis, and falling 10% during the 1992 recession. Furthermore, that earlier page from the 1980 annual report does show the firm’s asset base shrinking throughout the mid-1970s.
Nonetheless, the dividend has made very dependable headway. As far as I can tell, the payout has never been cut since at least 1971 and has been enlarged every year bar 1973-1978 and 2009.
I’m particularly encouraged how DJAN’s results have not been blighted by any exceptional items. Nor have there been any acquisitions that have created goodwill.
“This area has significant potential for increases in rental value”
Interim figures published in November showed total rental income flat at £66m, although DJAN claimed the underlying advance was 7% adjusting for currency movements and back-dated rent of £8m:
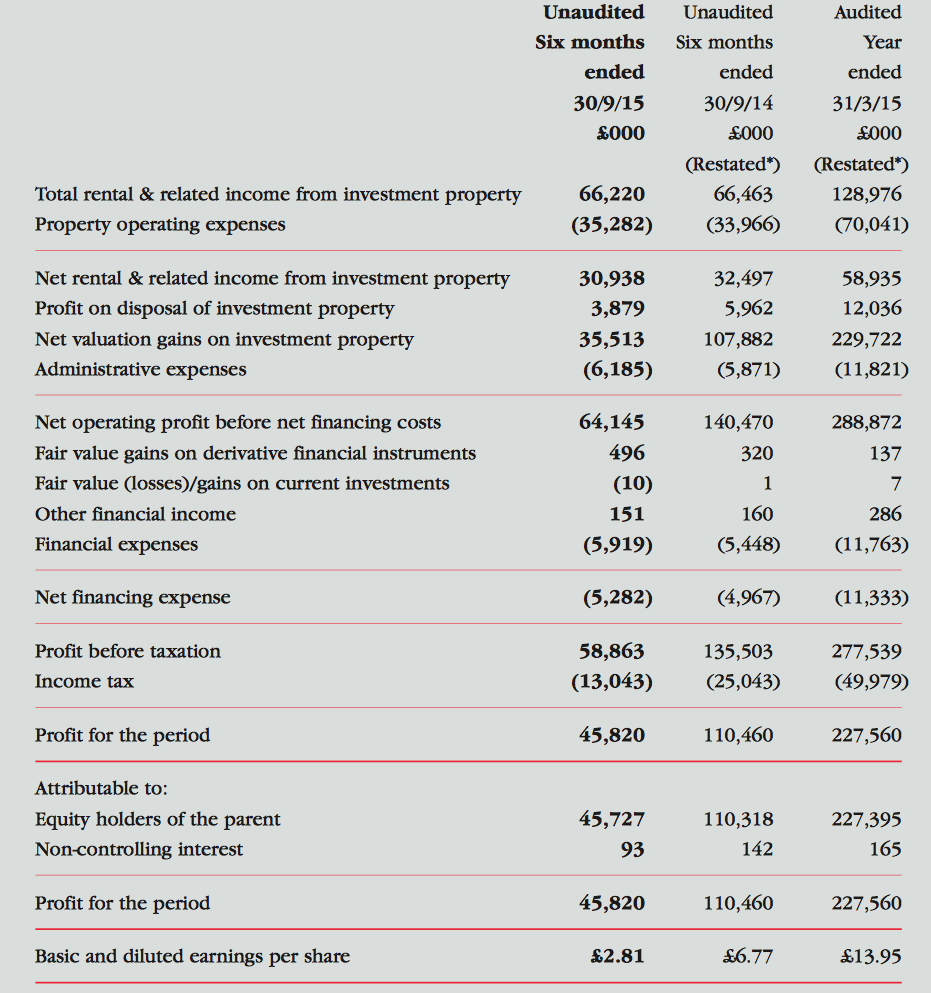
A further £36m upward revaluation helped take the overall value of the estate to £1,887m and the group’s NAV to £85 per share. The interim dividend was held at 35p per share.
Looking ahead, DJAN’s management did not appear entirely optimistic:
“In my last annual report I took a cautious view of the outlook and this remains my stance. Whilst economic circumstances at present are relatively benign in both the UK and USA, it seems likely that before long we will see the start of the rise in USA interest rates to be followed in due course by the UK.
Nevertheless the business should in the short term continue to benefit from the current favourable combination of low interest rates, low inflation and positive economic growth. We will continue with our proven strategy based on the prudent long term pursuit of growth in asset values.”
However, management’s comments within the 2015 annual report did suggest some confidence with various site developments (my bold):
“We have over many years accumulated a major property holding at the eastern end of Oxford Street, W1, close to the new Crossrail station. This year we completed the acquisition of the final property providing us with a substantial contiguous holding with frontages on Oxford Street, Berwick Street and Wardour Street. This area has significant potential for increases in rental value arising from improved transport links following completion of Crossrail which is scheduled for 2018/19.”
“In the UK we are actively considering a number of significant schemes of redevelopment which we hope to bring to fruition over the coming years. The most advanced of these schemes is the development of a 395 bed hotel for Travelodge on our Cromlech Street site on the eastern fringes of the City of London which is likely to commence in the coming year.”
“Shortages of both residential and office accommodation in central London are likely to ensure that market prices will show continued growth. It is to be hoped that signs of upward movement in property values outside London and the South East will continue as local markets benefit from the general growth in business activity.”
He took charge in 1980 and enjoys a £1m annual salary
Importantly for me, DJAN’s board is staffed by industry veterans who have delivered a considerable part of the group’s illustrious history. It is probably not a coincidence that these executives also oversee a substantial family shareholding.
The lead executive is Benzion Freshwater, who was appointed to the board in 1971 and became managing director when his father — the aforementioned Osias Freshwater — died in 1976. Benzion Freshwater took on the role of chairman during 1980.
Meanwhile, DJAN’s other executive, Benzion’s brother Solomon Freshwater, has been an executive since 1986.
Elsewhere in the boardroom, DJAN’s non-executives will not please governance watchdogs.
In particular, the senior non-exec, David Davis, has been a board fixture since 1971. He is also a trustee of various Freshwater family shareholdings and a director of certain DJAN subsidiaries. DJAN’s annual report somewhat understates his position as “technically not independent”.
Furthermore, the group’s two other non-execs are Raphael and Mordechai Freshwater, who are the son and son-in-law respectively of chairman Benzion Freshwater.
Appointed to the board in 2010, both Raphael and Mordechai are in their mid-40s and look set to succeed Benzion and Solomon in due course. The latter are in their mid-to-late 60s.
Some people may complain about the management set-up and the boardroom nepotism here, but this paragraph from the 2015 annual report summarises the situation for me:
“This Company has a successful track record… and the current [board] structure has stood the Company in good stead over many years and should continue to do so in future.”
I don’t have too many worries about board pay, either.
Although both executives are currently on hefty £1m annual salaries, they do not collect bonuses, nor do they receive pension contributions, nor do they own any type of option (no options have been granted).
What’s more, the chairman’s basic pay has risen in line with the group’s net asset value during the last decade — so I can’t really argue that he’s enjoyed extravagant wage inflation.
I attended DJAN’s AGM a few years ago, during which the company secretary confirmed to me that 80% of the group is controlled by the Freshwater family (via a complex mix of ordinary shareholdings, corporate investments, trust funds and charitable foundations).
The family’s aggregate stake is currently worth £743m and, by my reading of the accounts, the scale of the holding has barely changed for at least three decades.
The company secretary also told me the executives do not conduct media interviews and do not access the Internet (they are orthodox Jews).
“Managing risk has been central to the success of the Group over many years“
DJAN’s property estate dominates its accounts.
In particular, I’m pleased the estate’s £1,887m market value is six times the size of the group’s £301m total debt. With interest on the debt at about £12m a year and serviced by annual rental (and related) income of almost £130m, DJAN does not appear close to financial trouble to me.
In fact, I’d say a lot of DJAN’s past success has been due to its conservative financing. The group was (I presume) one of the very few property outfits that reduced its debts in the run-up to the banking crash — borrowings dropped from £178m to £115m between 2001 and 2007.
Indeed, having a property estate worth 11 times its total debt in 2007 left DJAN in a robust position when the downturn came a year later. As the 2015 annual report states:
“Managing risk has been central to the success of the Group over many years and in particular gearing has been kept at a relatively low level for the property industry.”
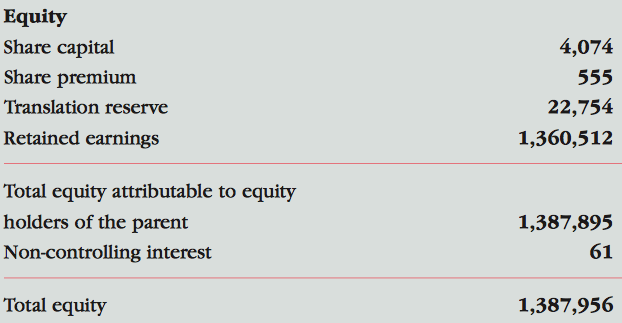
The latest balance sheet also confirms DJAN has not used extra equity to sustain its past expansion. Less than 1% of the group’s total equity has been funded by shareholders — with an amazing 98% created simply by retained earnings:
Everything is pointing to a return on equity of about 9%
Elsewhere in the accounts, I feel DJAN’s return on average equity (ROAE) is not too bad for a property company that operates without substantial borrowings.
Admittedly, the ROAE for individual years can be skewed by property valuation gains and losses — a ROAE of 20.1% was scored in a bumper 2015, while -21.5% was registered in the downturn of 2009. On average, though, the last ten years have witnessed an annual ROAE of 9.1%.
That 9.1% figure matches my other return on equity sums.
For example, during the ten years to 2015, DJAN’s equity base went from £38.94 to £81.84 per share, while dividends accumulated in the meantime came to £7.55 per share. The £50.45 per share gain (£81.84 less £38.94 plus £7.55) equates to a CAGR of 8.7% on the initial £38.94 per share equity value.
On the same basis, the CAGRs for the ten years to 2010, 2011, 2012, 2013 and 2014 are 9.6%, 9.3%, 8.2%, 8.9% and 9.3%:
| 10yrs to 2010 | 10yrs to 2011 | 10yrs to 2012 | 10yrs to 2013 | 10yrs to 2014 | 10yrs to 2015 | |
| Start NAV (£) | 21.80 | 23.88 | 27.17 | 28.81 | 30.96 | 38.94 |
| End NAV (£) | 48.17 | 51.43 | 52.90 | 60.44 | 68.15 | 81.84 |
| Dividends accumulated (£) | 6.30 | 6.56 | 6.80 | 7.04 | 7.28 | 7.55 |
| Total return (£) | 32.67 | 34.11 | 32.53 | 38.67 | 44.47 | 50.45 |
| Total return/Start NAV (%) | 9.6 | 9.3 | 8.2 | 8.9 | 9.3 | 8.7 |
So everything is pointing to a return on equity of about 9% on average.
Other points of interest within the accounts include the absence of pension obligations, the share count remaining the same since the mid-1970s, and current tenants committing to pay future rent of at least £519m.
The obvious valuation measure is price to book
Trading at £57, the shares represent 67% of the latest £85 per share NAV. That looks a healthy discount to me.
Another way of looking at DJAN’s value is from a return on equity standpoint.
Assuming DJAN can earn an average of 9% a year from its £85 per share asset base, typical annual earnings would be £7.65 per share — represented by a mix of rental profit and valuation gains.
In theory at least, enjoying £7.65 per share a year from a £57 purchase is equivalent to a worthwhile 13% annual return.
But why could this share look cheap?
One reason why DJAN’s shares may appear undervalued is due to its low operating margins.
Operating profit as a proportion of total rental (and related) income has averaged 31% during the last five years. Such profitability would be considered attractive at a traditional trading company, but not within the property sector.
For instance, CLS Holdings (CLI), a similar-sized property group to DJAN, collected revenue of £119m during 2015 and converted £66m into profit — equivalent to a 55% margin.
Elsewhere, FTSE 100 member Land Securities (LAND) produced a £245m operating profit from revenue of £364m — a 67% margin — during its latest interim results.
Meanwhile, property minnow Panther Securities (PNS) managed to convert £7.4m of its £14.3m revenue into profit — a 51% margin.
I’ve delved into DJAN’s main accounts — as well as the books of the PLC’s many subsidiaries — and concluded that the group’s residential assets explain the low margins.
Evidence of what is going on comes from The Halliard Property Company Limited, a subsidiary of Daejan Traders Limited, which is a subsidiary of the PLC holding company. Here is an extract from Halliard’s 2015 accounts showing its property investments:
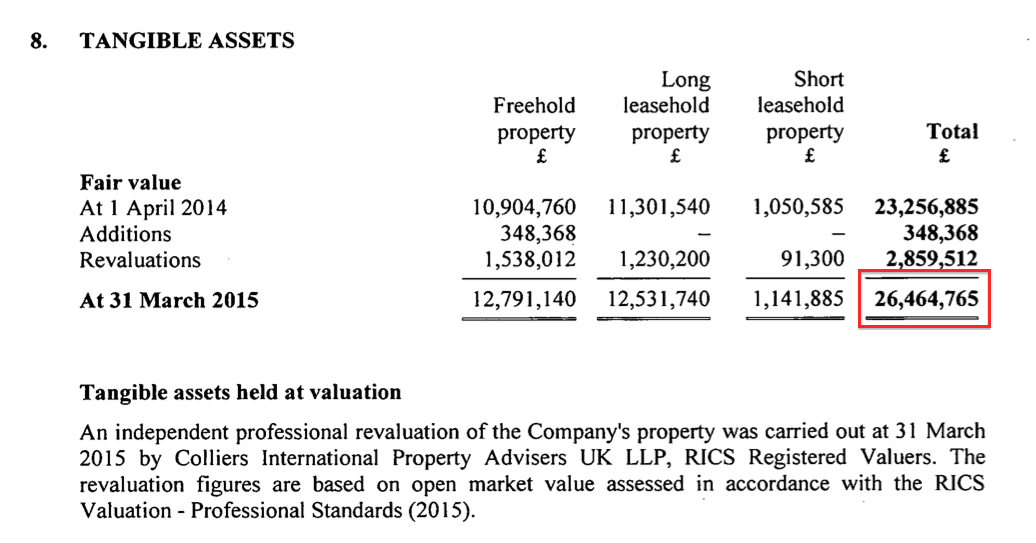
You can see £22m of the £26m are residential assets. But the £2.4m rental income from all of the properties is then gobbled up entirely by various expenditure:
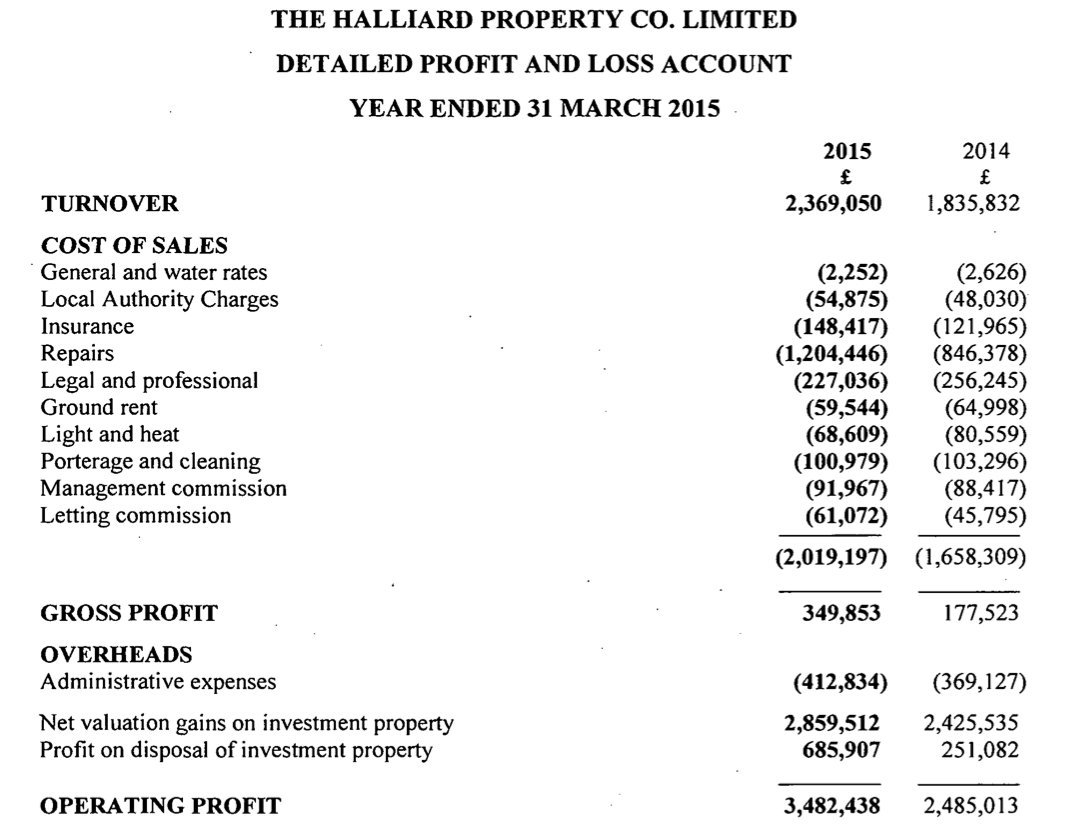
Notably, property repairs have represented a major expense for Halliard of late — and for the wider group for some years.
For example, the 1982 annual report refers to “substantial expenditure on repairs and renovation”…
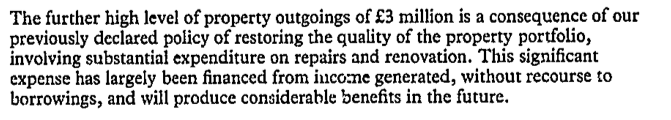
…the 2005 report cites “a substantial programme of repairs and refurbishment”…
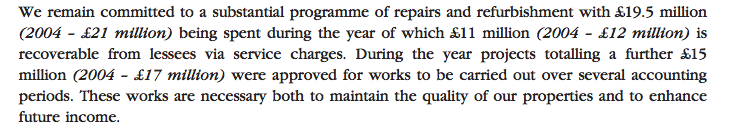
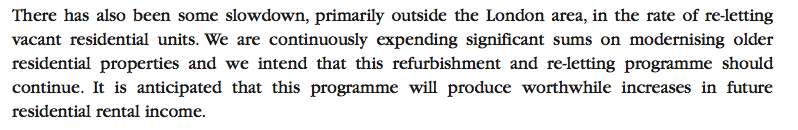
…while the 2014 report states “expending significant sums on modernising older residential properties”:
Anyway, Halliard is one of many ‘low-rent-but-high-cost’ residential subsidiaries within the wider DJAN empire. Here are four more:
* Daejan Properties: assets of £300m, rent of £18m, operating profit of £1.9m;
* Daejan Estates: assets of £48m, rent of £2.3m, operating loss of £6k;
* St Leonard’s Properties: assets of £19m, rent of £1.2m, operating profit of £81k, and;
* Seaglen Investments: assets of £13m, rent of £224k, operating profit of £23k.
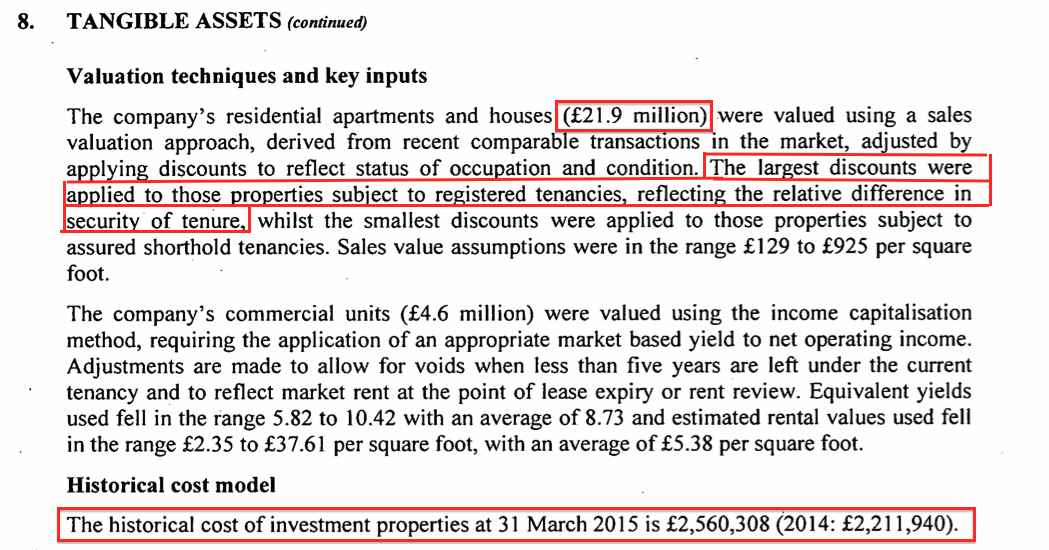
The accounts of all of these subsidiaries suggest the residential buildings in question are mostly regulated tenancy properties — the same as those owned by Mountview Estates (MTVW), where the tenant has a right to live in a property for a cut-price rent.
Only when the tenant leaves or dies can the property be re-let at a market rate — which in turn prompts the property’s market value to appreciate considerably.
Between them, Halliard and those four other subsidiaries own property with a £406m value, but in 2015 earned only a £1.9m operating profit from revenue of £24m — an 8% margin.
Still, regulated tenancies have been super long-term investments for DJAN. For instance, the small-print within the accounts of St Leonard’s Properties shows its properties were bought originally for only £390k — representing just 2% of their current £19.4m value!
Among DJAN’s commercial-property subsidiaries, margins are generally of a standard sector level.
For example, Daejan Investments, which owns various commercial sites in central London, declared revenue of £25.2m and a £15.8m operating profit during 2015 — a 63% margin.
Low margins do not really justify the valuation discount
As well as residential repairs, DJAN can often spend large amounts on refurbishing its commercial buildings.
The prime example recently has been Africa House, on which £40m was spent on refurbishments according to the 2010 annual report:
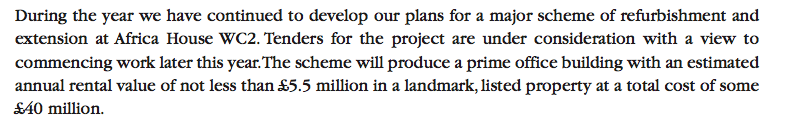
My reading of the DJAN’s accounts tells me such refurbishment costs are written off as incurred against that year’s profit, rather than being capitalised on the balance sheet. Some other property companies prefer to capitalise such expenditure.
Anyway, the 2013 annual report suggested further large refurbishment projects could be on the cards:
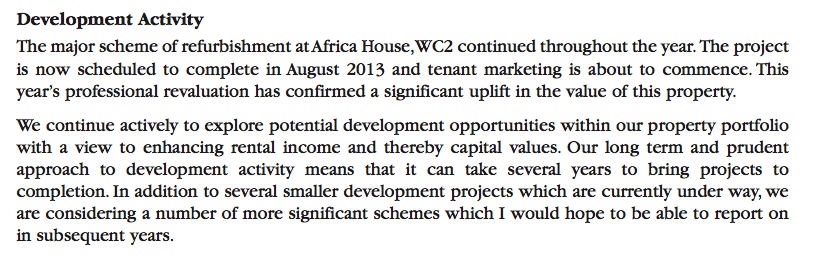
All told, a combination of low-rent residential properties that require costly repairs, plus sizeable commercial refurbishments, have kept a lid on margins over time.
However, DJAN’s history tells me that such low margins have still resulted in very healthy long-term NAV rewards — and therefore do not really justify the valuation discount.
A number of adverse factors could hit this investment
There are two major risks with this investment.
First and foremost, DJAN could be particularly vulnerable to fluctuations within London’s property market.
In particular, house prices in the capital are at elevated levels — evidenced in part by stories such as boiler rooms and small garages being sold for large sums.
Commercial rents in the capital appear to be booming, too, with record rents on Oxford Street and developers becoming bold enough to plan dozens of new skyscrapers.
Still, there are potential clouds looming over London property. A ‘Brexit’ could curtail demand from investors and foreign buyers, while recent stamp-duty increases may also hurt prices over time. In addition, an increase in interest rates could one day disturb current valuations.
Outside of London, DJAN’s local shopping centres and offices have not shown notable valuation increases. Repeating a theme from many previous years, the 2015 annual report admitted:
“Commercial properties in smaller provincial towns and cities continue to suffer from weak demand and increased vacancy rates.”
I suppose any number of adverse macro-economic factors could one day hit the valuation of DJAN’s property estate.
But overall, I am comforted somewhat by the fact the group’s NAV dropped by only 16% during the 2008 banking crash. Were DJAN’s NAV to drop 16% from its current level, the NAV would be £71 — and still 25% greater than the £57 share price.
Any re-rating may be somewhat limited and protracted
The other major risk I see with DJAN relates to its board.
The executives are very low profile and do not give much away about their business. In particular, RNS statements are very terse while annual reports contain no details about lettable space, occupancy rates, lease lengths and tenant types.
Then there is the board’s 80% family shareholding, with all the ‘fiefdom’ dangers that could create. What’s more, the Freshwater family owns a connected property group called Centremanor, the subsidiaries of which control property with a £543m accounting value.
Just how the Freshwaters allocate new property purchases between DJAN and Centremanor is not clear to me. And just how much time and effort the family expends on Centremanor at the expense of DJAN is not clear either.
It is worth noting that the same group of staff manage both DJAN and Centremanor properties, and I do wonder whether the operating lines between the two groups is somewhat blurred.
Anyway, the lack of disclosure and considerable related-party holdings go a long way to explain why there is little institutional interest in DJAN — and perhaps why the shares trade at a substantial discount to NAV.
Indeed, it’s quite possible the current discount may widen — and that the discount will prevail for some time.
For instance, back in 2010 and 2011, the shares traded at a 50% discount to NAV, while at the bottom of the banking crash, the price fell to 34% of NAV.
Furthermore, from what I can tell, the last 20 years have seen the shares exceed NAV only during the boom year of 2007. That suggests any positive re-rating may be somewhat limited and protracted — a prospect not helped by DJAN’s avoidance of buybacks.
I’m hopeful the 282-fold NAV gain is just the beginning
True, this is not the most exciting of investments, and it may not be the most rewarding either.
In particular, there are plenty of economic worries around that one day could knock the valuation of the group’s estate.
What’s more, the shares look cheap, but have looked cheaper in the past, and may never become ‘expensive’.
And all the time I’m in the stock, I’m a minority investor in a family-run firm that seems to give out the least amount of information possible to outsiders.
But DJAN’s track record does not suggest this share is a value trap.
On the contrary, it’s difficult to ignore the solid, established and conservative nature of the group and its directors.
It’s also plain to see that DJAN has prospered over the decades and through various economic conditions and political changes.
All told, I like to keep my investments as simple as I can and DJAN just looks to me to be a decent company trading at an undemanding valuation that I can hold for many years without too much aggravation.
In fact, I’m very hopeful the group’s 56-year, 282-fold NAV gain is just the beginning of things to come. Well, I have my fingers crossed.
Until next time, I wish you happy and profitable investing!
Maynard Paton
Disclosure: Maynard owns shares in Daejan.

“I’m particularly encouraged how DJAN’s results have not been blighted by any exceptional items.”
I’d consider every so-called “net-valuation-gain” an exceptional item.
Who needs extra goodwill if one gets year after year such an exceptional “goodwill-valuation”-item on the balance sheet?
Moreover. those paper profits are taxed. The cash flow must look horrible
Hello stanly,
Thanks for the comment.
Point taken on the net valuation gains being ‘exceptional’. Nobody really knows whether such paper gains are genuine or not until the assets are sold. DJAN does not sell many assets, so there is a judgment call there. However, the group does have a track record of regularly reporting such gains and I feel the management would have been found out by now if such gains were illusory. The rising rent roll underpins some of those valuation gains I guess.
The gains are taxed in the P&L, but the actual tax cash payments can be deferred under certain circumstances. DJAN pays a lot less tax than is shown in the P&L.
Maynard
Thank you, Mr. Paton, for a thorough and well considered article. I’ve had my eye on this company for a while now. It’ll be interesting to see what happens to its equity – implied and recorded – after BREXIT. I’ll be keeping an even closer eye on it now – with a view to buying!
Tim
Hello Tim
Many thanks for the Comment.
Maynard