10 February 2016
By Maynard Paton
Today I’m continuing my hunt for Watch List shares with a look at Rotork (ROR).
Here are the initial attractions that prompted this research:
* Majestic financial history: The accounts exhibit at least 45 years of rising earnings and dividends, plus lucrative operating margins and super returns on equity
* Culture of long-term, stable leadership: The company has been led by only four different bosses since its 1957 formation
* Interesting valuation: The shares have dropped 50% from their peak and the group’s sizeable exposure to the troubled oil and gas industry could lead to further short-term weakness
As usual, I’m applying a question-and-answer template to help me pinpoint companies that match the criteria set out in How I Invest. I’m looking for as many Yes answers as possible.
Activity: Designer and manufacturer of industrial valve actuators
Website: www.rotork.com
Share price: 155p
Shares in issue: 869,750,590
Market capitalisation: £1,348m
Does the business boast a respectable track record?
Yes.
ROR was established in 1957 when founder Jeremy Fry began designing electro-mechanical valve actuators after finding one in an old iron foundry . Valve actuators are essentially heavy-duty ‘taps’ used to automatically control the flow of liquids in a pipeline.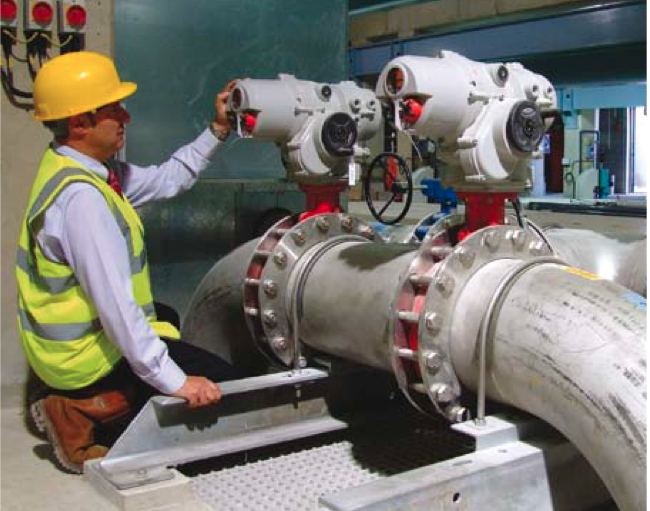
More than 50 years later, ROR now claims to be a market-leading actuator specialist and today supplies a wide range of electrical- and hydraulic-powered actuators (as well as the associated gearboxes and instruments) to various industrial clients. The devices can be found controlling pipes within oil refineries, power stations, chemical plants and sewage works.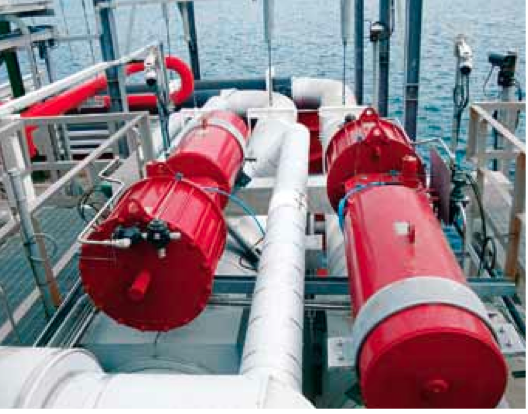
ROR floated back in 1968 and, amazingly, Companies House has annual reports stretching all the way back to 1973. The archives show that revenue was £2.6m and post-tax profit was £60k during the group’s first full year on the stock market.
Fast forward to 2014, and revenue had swollen to £595m and had taken earnings to £103m. Meanwhile, the dividend payment since the float has soared an eye-popping 2,688-fold — from £16k to £43m a year.
The growth rate over time has been very impressive and consistently in the double digits:
| 5 years to 2014 | 10 years to 2014 | 15 years to 2014 | 20 years to 2014 | |
| Revenue CAGR | 11.0% | 15.0% | 11.4% | 10.8% |
| Operating profit CAGR | 11.3% | 17.8% | 12.5% | 13.1% |
| Dividend per share CAGR | 12.0% | 12.7% | 9.9% | 12.4% |
Indeed, ROR’s longer-term track record is one of the most illustrious I have seen in the market.
Although revenue and profit for 2015 will suffer a setback (see below), you do have to go back to 2000 to find the company’s previous profit disappointment… and then back to the late 1980s to unearth the setback before that.
The latest five years of the group’s profit record is shown in the table below:
| Year to 31 December | 2010 | 2011 | 2012 | 2013 | 2014 |
| Revenue (£k) | 380,560 | 477,833 | 511,747 | 578,440 | 594,739 |
| Operating profit (£k) | 99,442 | 115,921 | 131,886 | 151,412 | 157,167 |
| Amortisation of acquired intangibles (£k) | (1,718) | (3,921) | (7,399) | (12,147) | (14,490) |
| Finance income (£k) | 131 | 550 | (273) | (1,268) | (1,062) |
| Pre-tax profit (£k) | 97,855 | 112,550 | 124,194 | 137,997 | 141,165 |
| Earnings per share (p) | 8.05 | 9.30 | 10.31 | 11.48 | 11.90 |
| Dividend per share (p) | 3.25 | 3.73 | 4.30 | 4.81 | 5.01 |
| Special dividend per share (p) | 1.15 | 2.30 | - | - | - |
ROR’s dividend history must be one of the most distinguished within the stock market. My reading of the archives indicates the payout has risen in all but one year (2000, when it was maintained) since the early 1970s. Compounding the dividend joy have been no less than six special payouts declared within the last 11 years.
I’m pleased ROR’s results have been devoid of any reported exceptional items since the mid-1990s.
Has the business grown mostly without acquisition?
Not sure.
The ten years to 2014 witnessed ROR spend around £240m on acquisitions — representing about a quarter of the aggregate operating profit recorded during the same time. That level of expenditure does not seem overly worrying given the aforementioned track record.
However, the acquisition spend has increased substantially of late. Of that £240m, some £212m was spent between 2010 and 2014 — while during 2015 another £115m was spent on a firm called Bifold and a further £15m on other deals.
In fact, with ROR predicting a £125m operating profit for 2015, my warning bell for acquisitive companies — be wary of businesses spending their entire annual profit on buying new subsidiaries — is starting to ring.
All told, I get the impression management may have become very keen to ‘buy growth’ as the group’s existing subsidiaries watch their own revenue slipping.
Has the business mostly self-funded its growth?
Yes.
The latest balance sheet displays share capital of only £14m versus earnings retained by the business of £378m. Furthermore, the underlying share count has barely moved for the last 25 years.
Does the business possess an asset-strong balance sheet?
Not at the moment.
ROR had operated with net cash since at least 1990 until last year… when the aforementioned Bifold deal shifted the group’s balance sheet to a net debt position of £86m.
The borrowings appear manageable given ROR’s predicted operating profit of £125m for 2015. But I do wonder if the board now has a taste for debt and whether further deals will require additional loans.
Also among the liabilities is a pension scheme that carried a £36m deficit at the end of 2014.
Again, this liability looks manageable given ROR’s near-term profit projection. But since 2010 the group has pumped some £17m into the scheme through ‘catch-up’ payments — and none of this £17m has been charged to the income statement.
Does the business convert profits into free cash?
Yes.
| Year to 31 December | 2010 | 2011 | 2012 | 2013 | 2014 |
| Operating profit (£k) | 99,442 | 115,921 | 131,886 | 151,412 | 157,167 |
| Depreciation and amortisation (£k) | 4,611 | 5,211 | 6,376 | 8,015 | 9,457 |
| Net capital expenditure (£k) | (5,898) | (11,197) | (13,632) | (12,293) | (19,970) |
| Working-capital change (£k) | (10,825) | (19,656) | (15,035) | (14,304) | (19,567) |
| Net cash (£k) | 97,705 | 48,205 | 59,696 | 66,663 | 25,239 |
Granted, the last five years have seen total cash capital expenditure exceed the aggregate depreciation and amortisation charged against reported profits by about £30m.
However, that £30m excess is not enormous compared to the cumulative operating profit of £656m recorded during the same time. Furthermore, about half of that £30m was spent on land and buildings, which tends to be expansionary expenditure and should retain its value.
Turning to working capital, changes in stock, debtor and creditor levels since 2011 have absorbed a combined £79m — which again does not look that worrying when compared to the £656m accumulated operating profit.
Does the business enjoy a competitive advantage?
I believe so.
During the last 15 years, the operating margin has averaged 23% and the last time it dipped below 20% was 2000.
Such high and consistent levels of profitability are very impressive, and ROR’s annual reports cite technological leadership, worldwide service coverage and an extensive product range as reasons for its lucrative sales.
I presume product quality is uppermost in the minds of prospective customers. Actuators have to work in harsh weather at out-of-the-way places, and I assume failure could mean costly problems — perhaps involving risk to worker safety — at a major industrial plant.
I suppose that ROR’s pioneering history and sound reputation have also gone towards creating a bit of a competitive ‘moat’. For what it’s worth, ROR reckons its strengths have garnered the company a near-19% market share of industrial actuators globally: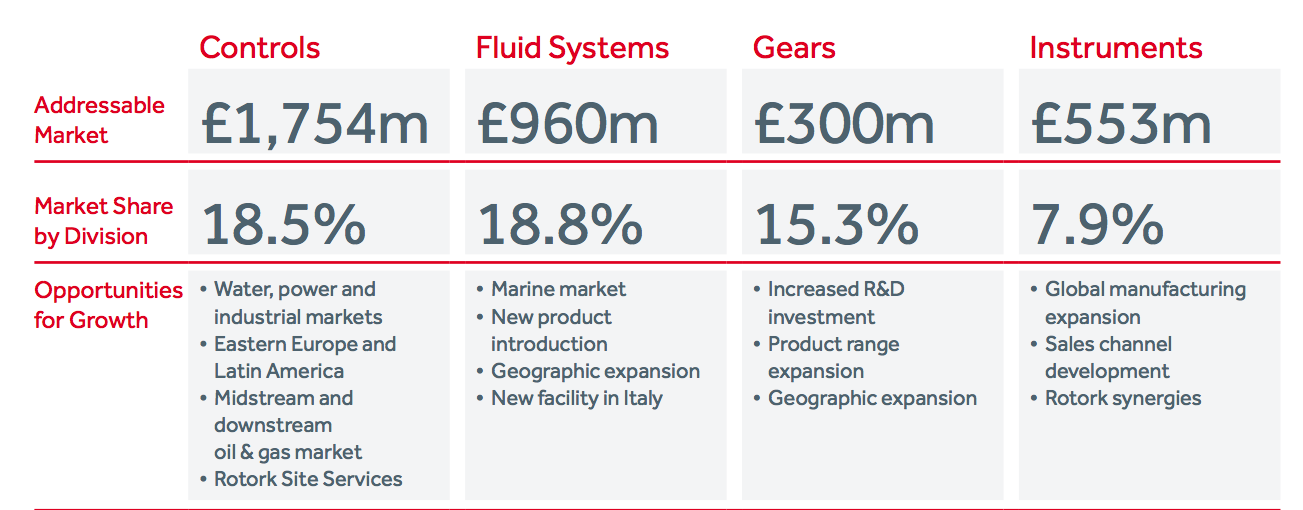
Emphasising the high-value nature of the products, revenue per staff member came in at a wonderful £184k for 2014. Something to note, though, was that figure had topped £200k in the years before and was the lowest since 2008.
Does the business produce a respectable return on equity?
Yes.
Return on average equity for 2014 was £103m/£354m = 29%. A very attractive figure, albeit the lowest percentage for at least the last ten years. Denominator adjustments for net cash and the pension deficit still result in figures of 29% or more for the last decade.
Does the business employ capable executives?
Possibly.
Certainly ROR has developed a culture of longer-term leadership. The aforementioned Jeremy Fry was boss for 27 years, while successors Tom Eassie and Bill Whitely both enjoyed 12 years in charge. Peter France became the current chief exec in 2008.
I can’t really complain about ROR’s general progress under Mr France’s leadership. And still in his 40s, Mr France may not be appointing his own successor anytime soon.
But I do note that Mr France’s tenure at the top has coincided with i) much greater acquisition activity (and the risk of associated problems), and; ii) what will be the group’s first profit shortfall for 15 years (see below).
As such, I do wonder if Mr France’s abilities will be tested in the not-so-distant future.
Does the business employ good value-for-money executives?
Probably.
Mr France received a £422k basic salary and a £348k bonus during 2014 — which I guess is not completely outrageous when underlying operating profit inched 4% higher to £157m.
I should add that ROR’s bonus payments are partly based on three-year profit advances, which helps explain why Mr France can enjoy a sizeable bonus during years of modest progress. Anyway, during his tenure as chief exec his total pay has averaged almost £1.1m a year.
At least Mr France’s basic wage has advanced by just 5% per annum since his appointment as chief exec. In contrast, the annual dividend has grown about 12% a year during the same time.
Does the business employ owner-orientated executives?
Maybe.
Mr France has a £1m ordinary shareholding, which is not that unusual for a FTSE 250 chief exec.
What is unusual, though, is that he has declared two special dividends during his time at the top.
Such handouts suggest he is sensible enough to return surplus cash to shareholders… so perhaps I should not be too worried about the substantial acquisitions he’s since overseen.
I’m pleased Mr France has restricted the number of outstanding employee options to less than 1% of the total share count.
Does the business enjoy reasonable growth prospects?
Probably not in the short term.
Half-year results in August showed every number bar the dividend going lower…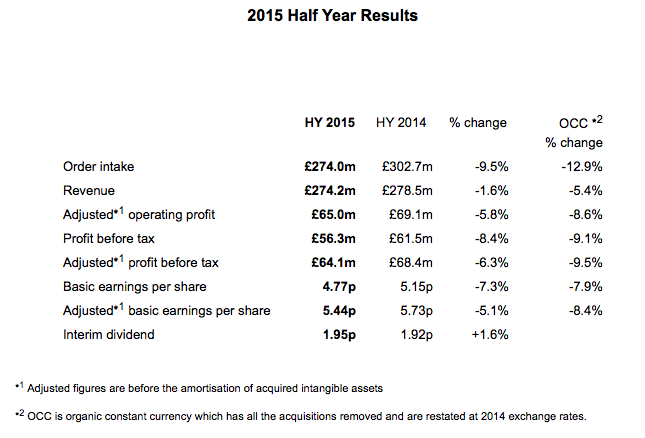
…while the presentation accompanying the results confirmed that 52% of revenue was still dependent on the troubled oil and gas sector: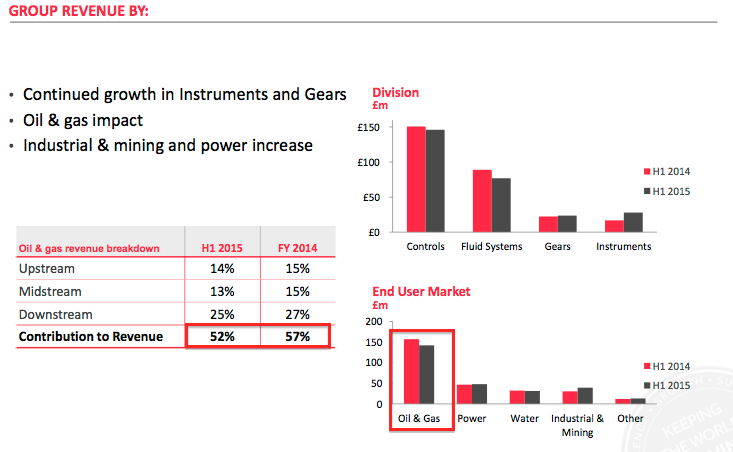
Looking ahead, Mr France said:
“The continued weakness of the oil price and geopolitical uncertainty in some of our key markets resulted in a challenging trading environment during the first half, with lower overall activity levels and an increased number of project deferrals and cancellations.”
And a month later he admitted:
“A number of orders expected to be placed in the third quarter have been delayed with delivery now anticipated in 2016, impacting the Group’s results for the current year…
Taking all of the above into account and based on current exchange rates, we now expect revenue for the year to be in the range of £530m-£555m with adjusted operating profit in the range of £120m-£130m.”
That financial guidance was reiterated in November and equates to 2015 revenue and profit dropping 9% and 21% respectively. The projected decreases for the second half of 2015 are even more marked — revenue down 15% and profit down 32%.
Looking back through the archives, I see ROR’s prior setback — back in 2000 — was also caused by an oil-price slump. This Telegraph article provides a good short summary of that particular upset.
All in all, I guess that majestic track record may start to look a tad less impressive if we are in for a prolonged oil downturn.
Does the share price stand a good chance of becoming a bargain?
I think so.
Taking ROR’s £125m mid-point profit forecast and applying tax at the firm’s anticipated 26%, I arrive at possible earnings of £92m or 10.6p per share.
Then adjusting the £1,348m market cap for the £86m of net debt and the £36m pension deficit, I come to an enterprise value (EV) of £1,470m or 169p per share.
The potential P/E on my EV and EPS estimates is therefore 16.
Normally 16 would be a fairly reasonable rating for such a quality outfit. But with second-half profit down 32% and some City brokers predicting earnings of less than 9p per share for 2016 — that is, down 10% on 2015 — then I suspect there may be better buying opportunities ahead.
Meanwhile, the trailing 5.01p per share dividend supports a 3.2% income.
Is it worth watching Rotork?
Yes.
I find it very difficult to ignore quality businesses when their share price is down 50% from its high.
ROR certainly exhibits some exceptional financials and its consistently elevated margins and equity returns must surely rank among the best in the FTSE 250. I can only deduce the group’s actuators enjoy a tremendous competitive advantage, which I’d like to think can underpin the company through the current oil and gas downturn.
Earnings are likely to drop again in 2016, and you have to go back almost 30 years for the last time ROR suffered two consecutive profit setbacks. As such, investors are effectively entering unchartered territory now and I do wonder whether the shares can drop further as the market begins to lose faith.
Mind you, ROR’s substantial expenditure on acquisitions has not been the most encouraging of signs. It appears Mr France is keen to buy growth and the shift to a net debt position may in time prove significant.
But for now, ROR offers more than enough to justify a watch-list slot… and I shall be reading the group’s results next month with interest.
Maynard Paton
Disclosure: Maynard does not own shares in Rotork.

I’m not sure how much the Bifold Group acquisition diversifies ROR in terms of the way the products serve markets. Maybe it increases the international footprint.
If I am correct then the company remains subject to O&G spend and whether it was a good buy depends on how Bifold is withstanding the environment.
On the whole the Gloucester companies record of acquisitions has not been that good, except for SPX purchase of Marlow.
A very insightful analysis. Ta.
apad
Hello apad,
Thanks for the comment. Bifold supplies instruments, but has significant O&G exposure if I recall correctly.
Maynard
Rotork (ROR)
Twitter feedback:
I’ve received some feedback on Twitter asking about ROR’s dividend growth on a per-share basis.
I’ve looked through the old annual reports and I do not have a share count for 1969. The best I can do is for 1972, where the stated share count was 3,165,343. Adjusting for a 1 for 5 scrip issue in 1973, a 2 for 1 capitalisation in 1975, another 2 for 1 capitalisation in 1977, a 3 for 1 capitalisation in 1993 and a 10 for 1 capitalisation in 2015, I reckon the adjusted share count in 1972 was 455,809,392.
The dividend paid in 1972 came to £30,058 or 0.00659p per share on the adjusted share count. Assuming the adjusted share count was the same for 1969 as for 1972, the £16k dividend equates to 0.00351p per share.
Going on those dividend figures, the dividend CAGRs to 2014’s 5.01p per share are 17.52% over 45 years from 1969, and 17.11% over 42 years from 1972.
That compares with the 19% or so CAGR that the absolute dividend payment — from £16k to £43m — enjoyed from 1969 to 2014.
Maynard
Interesting way of looking at the company and a great analysis. I will add ROR to my watch list. I believe, that it could be a bargain and a very profitable long-term investement.
Thanks for a detailed, logical and well-documented analysis of Rotork’s long term history and its current condition and prospects.
I will not pretend to know what might happen in the next few years but, on Digitallook estimates for 2017 DPS then a 5.54p dividend and a share price of 162p (my recent top up) gets me to a forward dividend yield of 3.4 percent.
Assuming a constant rating, a 3.4 percent dividend yield and 6.6 percent earnings growth would get me to double digit TR CAGR over the long term: I suspect Rotork will do better than this, grow earnings and trade at a higher rating than it does today. If it does go lower in the short term, then that would present a chance to top up at a lower valuation.
Hello Mark
Thanks for your Comment and I am glad you found my write-up useful.
Maynard
Hi. I was rotorks publicity officer from 1969 until 1973. Jeremy was a great guy to work with. Loads of great times.