30 July 2015
By Maynard Paton
Today I’m continuing my hunt for Watch List shares with a look at Panther Securities (PNS).
Here are the initial attractions that prompted this research:
Thin-cat management: The boss last collected a salary during 2006
Resilient dividend: The payout has not been cut following the group’s 1994 flotation
Interesting valuation: The shares trade at 86% of net asset value
As usual, I’m applying a question-and-answer template to help me pinpoint companies that match the criteria set out in How I Invest. I’m looking for as many Yes answers as possible.
Activity: Commercial property landlord
Website: www.pantherplc.com
Share price: 350p
Shares in issue: 17,487,295
Market capitalisation: £61.2m
Does the business boast a respectable track record?
Yes and no.
PNS can trace its history back to 1934, when it started out manufacturing spectacles and lenses. By 1972 the firm had been acquired by property agent Andrew Perloff for its freehold assets, and became a pure commercial-property business a few years later.
Today PNS owns more than 800 individual properties, most of which are secondary retail and industrial units located outside of London. The company floated during 1994 when its rental revenue was £3.5m, its net asset value (NAV) was £18.6m and its dividend was 2.7p per share.
By 2014, revenues had reached £12.5m, NAV had enlarged to £71.6m while the dividend had advanced to 12.0p per share.
The growth rates over time have been modest:
| 5 years to 2014 | 10 years to 2014 | 15 years to 2014 | 20 years to 2014 | |
| Revenue CAGR | 6.2% | 3.1% | 5.2% | 6.6% |
| Dividend per share CAGR | - | 4.1% | 4.7% | 7.7% |
| Net asset value per share CAGR | 0.3% | 3.4% | 5.5% | 7.4% |
Annual profits have bobbed up and down due to property revaluations, adverse derivative movements and the occasional profit from share investments. However, the dividend made good advances between 1994 and 2006 when it quadrupled in value.
PNS’s progress since the credit peak has been somewhat stagnant. The payout has been held at 12p per share for eight years now while the latest NAV, at 409p, is less than it was in 2006:
| Year to 31 December | 2010 | 2011 | 2012 | 2013 | 2014 |
| Revenue (£k) | 10,085 | 11,940 | 12,673 | 12,502 | 12,512 |
| Operating profit (£k) | 4,496 | 4,638 | 5,548 | 7,003 | 6,201 |
| Profit from property sale (£k) | - | - | 241 | 385 | (57) |
| Revaluation of property (£k) | 4,039 | 5,671 | (4,967) | 742 | 13,110 |
| Finance costs (£k) | (2,265) | (2,954) | (4,466) | (5,226) | (5,263) |
| Derivative movement (£k) | (2,549) | (10,635) | (777) | 6,043 | (9,813) |
| Other items (£k) | 2,680 | 968 | (212) | (706) | 32 |
| Pre-tax profit (£k) | 6,401 | (2,312) | (4,633) | 8.241 | 4,210 |
| Earnings per share (p) | 34.8 | (5.1) | (17.2) | 42.1 | 26.1 |
| Dividend per share (p) | 12.0 | 12.0 | 12.0 | 12.0 | 12.0 |
| Net asset value (£k) | 71,318 | 67,066 | 62,053 | 67,916 | 71,554 |
| Net asset value per share (p) | 423 | 398 | 368 | 395 | 409 |
Part of the problem seems to be PNS deciding to fix its interest payments at about 7% in 2008. Finance costs now absorb a fair chunk of operating profits (70%-plus during 2014) and the associated rate-swap derivative has created a £24m liability on the balance sheet (more on that later).
Has the business grown mostly without acquisition?
Yes.
The last ten years have not witnessed any acquisition activity and the balance sheet does not carry any goodwill.
Has the business mostly self-funded its growth?
Yes.
The latest balance sheet displays share capital of £9m versus earnings retained by the business of £62m. Furthermore, PNS has not issued any new shares (barring shares for scrip dividends).
Does the business possess an asset-strong balance sheet?
Sort of.
At the last count, cash stood at £5m while investment and stock properties were valued at £174m, which combined more than offset bank loans of £72m.
However, the balance sheet also shows a derivative financial liability of £24.5m (140p per share), which is the result of PNS entering into an interest-rate swap back in 2008.
Now, I am not an expert in derivative accounting, but it seems to me as if PNS has locked itself into paying interest on the majority of its debts at about 7% until at least 2021:
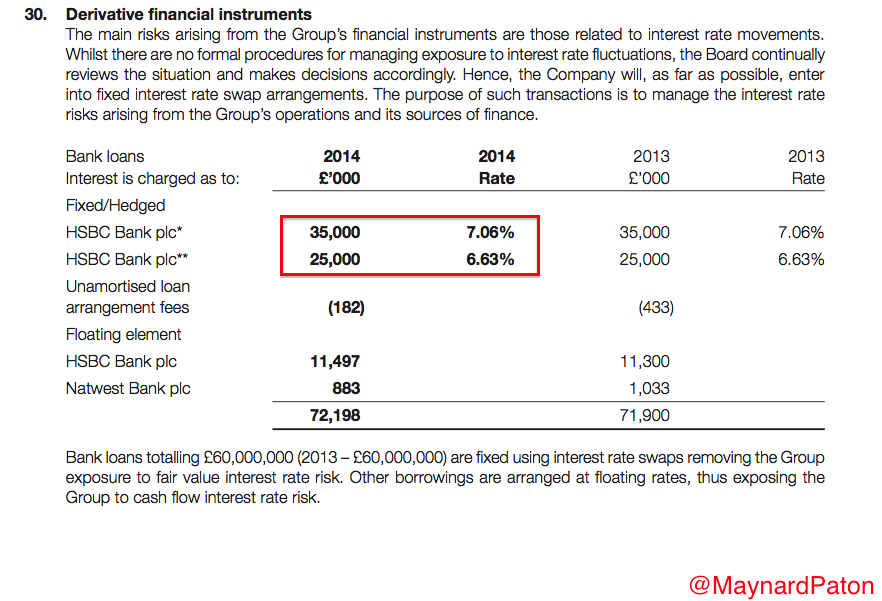
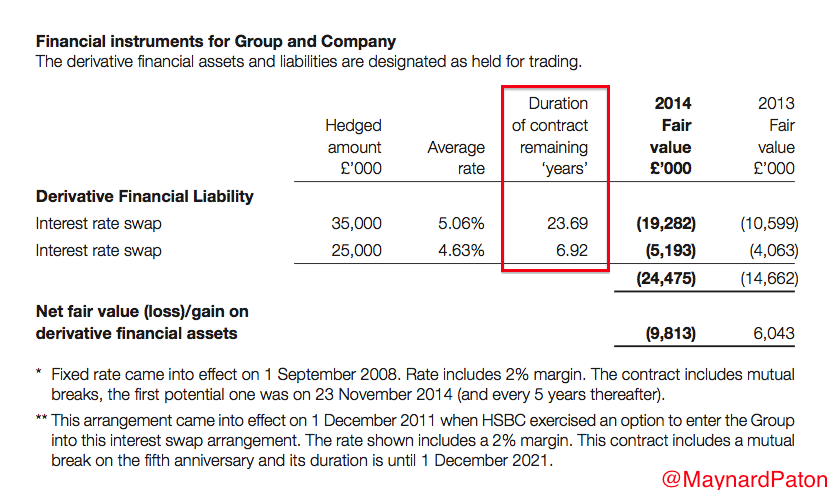
For its part, PNS correctly states the derivative liability has no annual cash cost and may disappear over time if/when interest rates “normalise”. I note some of the debt has interest payments fixed until 2038.
Last year PNS paid cash interest of £4.5m which — versus operating profits of £6.2m — did not leave that much surplus money left for dividends and reinvesting back into the business.
All in all, I have the feeling it is the group’s interest payments that may have stifled its NAV and dividend progress during recent years.
Does the business convert profits into free cash?
Yes.
| Year to 31 December | 2010 | 2011 | 2012 | 2013 | 2014 |
| Operating profit (£k) | 4,496 | 4,638 | 5,548 | 7,003 | 6,201 |
| Depreciation (£k) | 137 | 122 | 134 | 106 | 95 |
| Cash capital expenditure (£k) | (796) | (59) | (49) | - | (82) |
| Working-capital movement (£k) | 1,305 | 258 | (809) | 244 | 3,065 |
On aggregate, the last five years have seen minimal non-property capital expenditure alongside favourable working-capital movements.
Does the business enjoy a competitive advantage?
Any advantage will be due to management (see below).
The 2014 annual report refers to locations such as Park Road Peterborough, Queen Street Mansfield and 8-12 High Street Broadstairs, which may (or may not!) be local property ‘gems’…
Does the business produce a respectable return on equity?
Probably not.
Adjusting for property revaluations, derivative movements and one-off items, I calculate the return on average equity for 2014 was approximately £1m/£70m = 1%.
Adding back interest payments and tax to the numerator, and bank borrowings to the denominator, I get a 2014 return on capital employed figure of less than 4%.
It’s difficult to make an accurate assessment of PNS’s RoE and RoCE figures, given the group’s various property revaluations and devaluations, and that sizeable rate-swap derivative liability.
With NAV and the dividend having stagnated for some time now, my gut feel is that the group’s equity returns have been poor.
Does the business employ capable executives?
Possibly.
The aforementioned Andrew Perloff has been in charge since 1972 and therefore takes responsibility for PNS’s somewhat mixed quoted performance.
Mr Perloff is now in his 70s and looks likely to be succeeded by another member of the Perloff family. John Perloff has been an executive director since 2005 and is in his 40s.
Does the business employ good value-for-money executives?
Yes.
Boss Andrew Perloff has not collected a salary since 2006 and took home benefits of just £5k last year.
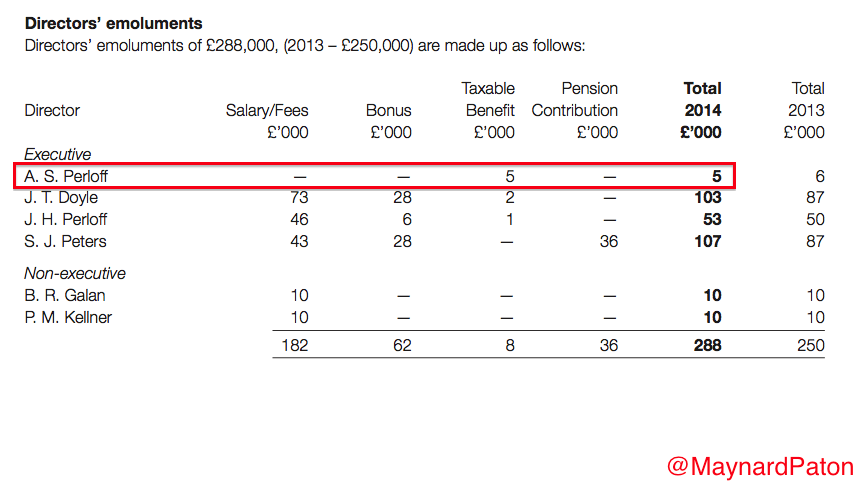
The archives show he initially waived his salary as a “symbolic tax strike” and I can only assume he remains on the picket line outside HMRC.
Does the business employ owner-orientated executives?
Yes.
The Perloff family has a combined 71%/£44m stake that has been largely unchanged for the last 20 years. I also like the fact the directors have declared five special dividends since 1994 and can work without an option scheme.
Does the business enjoy reasonable growth prospects?
Maybe.
The 2014 annual report stated:
“Last year I said there was a feeling of optimism in the property market and this continues, initially shown by the independent valuation but I am hoping some of this will be crystalized into realised profits and increased letting activity, resulting in increased rental income and therefore stronger profitability.”
Rental profits are likely to increase during 2015 because the 2014 results included ‘one-off’ redevelopment work costing £0.9m at a site in Wimbledon, London.
Does the share price stand a good chance of becoming a bargain?
The 350p share price does not look expensive at the moment — it represents 86% of the latest 409p per share NAV.
However, a quick check of the PNS price chart shows the shares have always sold at a discount to NAV. Indeed, the 415p all-time high seen in 2011 compared to a then NAV of 423p per share, while the 385p pre-crunch top of 2006 was less than the then NAV of 398p.
During early 2009, the shares dropped to close to 200p despite a then NAV of 391p per share.
Is it worth watching Panther Securities?
Good question.
True, there are few quoted-company executives that have saved shareholders close to £1m by forgoing their salaries for the last eight years. Investors also get the reassurance of a substantial family shareholding and loyal executive tenures.
The shares trade below book value, too.
Yet I can’t help feeling a bit let down by the progress at PNS.
In particular, the stagnant dividend and NAV are somewhat disappointing when you consider the recent achievements by other operators in the sector — including my industry fave Dajean.
Overall, I get the impression PNS has been held back by its debts. In fact, my rough sums suggest two-thirds of its rental profit could be absorbed by interest costs during 2015, while the last results from Daejan for instance showed just a quarter of its rental profit went on servicing debt.
Looking ahead, my reading of PNS’s accounts is that the group could be hindered by its interest-rate swap for some time to come. That’s a shame, as I had thought the group’s old-fashioned, loyal and thin-cat boss was ideal for my portfolio.
Still, there is always the top-notch management to consider at Daejan — where the history, accounts and prospects all appear more favourable than those of PNS.
Maynard Paton
Disclosure: Maynard does not own shares in Panther Securities.
