18 February 2015
By Maynard Paton
I’m continuing My Watch List today with a look at Daejan (DJAN).
As before, I’m using a question-and-answer template to help me quickly pinpoint worthwhile shares that match How I Invest.
I’m looking for as many Yes answers as possible.
Activity: Commercial and residential property landlord
Website: www.daejanholdings.com
Share price: £58
Shares in issue: 16,295,357
Market capitalisation: £945m
Does the business boast a respectable track record?
Yes.
Read these excerpts from past annual reports:
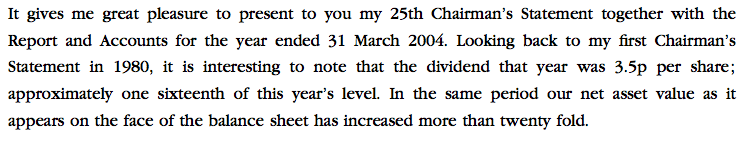
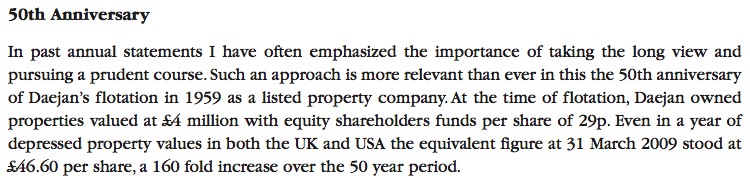
Now 55 years since flotation, net asset value (NAV) is up 259-fold to £75 a share — or about 11% per annum.
Compound average growth rates during more recent times:
| 2010 to 2014 | 2006 to 2014 | 2000 to 2014 | |
| Rental income CAGR | 3.2% | 3.3% | 4.3% |
| Operating profit CAGR | 1.5% | 1.4% | 1.0% |
| Dividend per share CAGR | 2.4% | 3.3% | 4.2% |
| Net asset value CAGR | 7.9% | 6.4% | 8.6% |
A NAV setback has occurred only once since 1992 (2009 — down 16%) and dividend not cut since at least 1989. Track record not blighted by major or ongoing exceptional items.
| Year to 31 March | 2010 | 2011 | 2012 | 2013 | 2014 |
| Rental income (£k) | 99,913 | 102,692 | 107,094 | 111,037 | 112,202 |
| Operating profit (£k) | 33,917 | 31,391 | 27,923 | 33,084 | 32,863 |
| Property gains (£k) | 5,073 | 9,257 | 16,254 | 6,612 | 11,320 |
| Property revaluation (£k) | 24,997 | 52,024 | 15,683 | 82,694 | 119,648 |
| Finance income (£k) | (2,858) | (8,309) | (18,011) | (10,703) | 674 |
| Pre-tax profit (£k) | 61,129 | 84,363 | 41,849 | 111,687 | 164,505 |
| Earnings per share (p) | 280 | 416 | 221 | 550 | 919 |
| Dividend per share (p) | 74 | 75 | 76 | 79 | 82 |
Something to consider: Operating profit at £33m for 2014 at same level reported for 2006. Total operating costs as proportion of rental income since that time have increased from 65% to 71% — a very high percentage compared to wider sector. However… November’s interim results signalled a profit and margin upturn (see below).
Has the business grown mostly without acquisition?
Yes.
Balance sheet shows no goodwill and results from at least 2000 show no business purchases.
Has the business mostly self-funded its growth?
Yes.
Balance sheet shows net assets represented by issued share capital of £5m and retained earnings at an eye-popping £1,202m.
Does the business possess an asset-strong balance sheet?
Yes.
Investment property valued at £1,682m, cash is £53m and borrowings are £300m. Debt as a proportion of gross assets is 17% — relatively low for the sector — and has not topped 20% since 2003.
No final-salary pension obligations.
Does the business convert profits into cash?
Yes.
| 2010-2014 | 2006-2014 | |
| Total operating profit (£k) | 159,178 | 287,857 |
| Total cash generated from operations (£k) | 154,839 | 275,341 |
About 95% of operating profit has been converted into cash.
Does the business enjoy a competitive advantage?
Sort of.
Past success due to experienced and sensible management (see below).
Does the business produce a respectable return on equity?
No.
NAV between 2009 (depressed property market) and 2015 (upbeat property market) has advanced from nearly £47 to £75 per share. Plus accumulated dividends of almost £5 gives total return of £33 per share. Six years to earn £33 on £47 requires CAGR of 9.4%.
Calculations from 2000 (average property market) and 2006 (toppy property market) to 2014 give CAGRs of 9.6% and 7.5% respectively.
These and other sums suggest average long-term ROE is a middling 8.5%.
Business-perspective investor demanding ROE greater than 8.5% must therefore buy asset base below book value. 10% return requires 15% discount (i.e. P/NAV of 0.085/0.1 = 0.85). 15% return requires 43% discount (i.e. P/NAV of 0.085/0.15 = 0.57)
Does the business employ capable executives?
Yes.
Members of the Freshwater family have been in charge since 1959. Present board employs just two execs — with executive chairman in charge since 1980. Other executive a board member since 1986.
Both execs in their 60s. Next generation of Freshwaters (in their 40s) appointed non-execs in 2010 — and presumably will take charge at some point. Another non-exec has been a board fixture since 1971. Fourth non-exec appointed in November.
Does the business employ good-value-for money executives?
Good question.
Chairman’s basic pay in 2014 was a mighty £870k — up 6% a year on average since 2006. Shareholder income via the dividend, however, up just 3% annually during the same time. Comparison for last five years: chairman up 4% a year, dividend up only 2% a year.
But difficult to begrudge payments given long-term achievements to date.
No bonuses and no pension contributions.
Does the business employ owner-orientated executives?
Yes.
Freshwater family own c80% of share base (£756m) via complicated web of trusts and holdings. Family’s annual dividends almost £11m. No options in place. Share count unchanged since at least 1996. But some related-party disclosures need further investigation — could explain high operating costs.
Does the business enjoy reasonable growth prospects?
Yes — assuming property prices rise long term and upwards revaluations continue to bolster NAV.
Something to consider: Investment property book value advanced £671m between 2005 and 2014 — 60% of which due to revaluations. Between 2010 and 2014, advance was £420m with 70% due to revaluations.
c80% of company’s assets located in UK — mix of residential and commercial property mostly in London and South East. 20% located in US, mostly residential in New York. Capital locations likely to remain popular long term.
November’s interim figures showed profits before revaluations up a substantial £10m to £27m following the completion of a major property refurbishment and the collection of back-dated rent. Costs as proportion of income fell to 60% — a level not seen since 2003. The asset base enjoyed a £114m revaluation, too.
Chairman said: “We believe that our tried and tested strategy, based on the prudent long term pursuit of growth in asset values, will enable us to make continued progress in challenging times.”
Does the share price stand a good chance of becoming a bargain?
Not sure.
Share price at £58 and NAV at £75 gives P/NAV of 0.77. Relatively cheap compared to wider sector.
But share price has generally traded below book — see ROE answer above for possible explanation.
P/NAV was c0.5 for lengthy periods during 2010, 2011 and 2012 (when share price less than £30) and was as low as 0.34 during 2009 (when share price hit £17). In recent times P/NAV above 1 seen only during late 2006 and credit boom — buyers then paying £53-plus suffered poor returns.
Past dividend/NAV growth suggests current £58 indicates 10-11% potential returns. Demanding 12.5% might require P/NAV of 0.71 and £53 entry price. Demanding 15% might require P/NAV of 0.57 and £42.50 entry price.
Is it worth watching Daejan?
Yes.
Track record, finances and management indicate textbook long-haul business — 259-fold NAV growth could be just the start :-) Future progress likely to be dependable and steady if unspectacular. Current share price not grossly expensive given latest NAV progress — though much better buying opportunities have occurred not so long ago. Solid benchmark from which to judge other operators in sector.
Must monitor operating costs — seem high compared to sector. However, latest interim results may have indicated permanent step-change in profitability. Related-party transactions need consideration as well.
Maynard Paton
Disclosure: Maynard does not own shares in Daejan.

Hi Maynard,
I have really enjoyed reading the commentary on this website and your approach to investing. I am sure there is an awful lot to be learnt from your approach, none more so than your manner of writing down your thoughts. Clear goals and approaches to investing in shares is a proven way of setting yourself up for success rather than failure! I am going to start taking a similar approach (or at least that’s what I tell myself).
In the case of Daejan, I find it really hard to see past the 80% shareholding of the Freshwater family, the board and the related party transactions going through Daejan. It is hard to understand why they keep the company on a public listing when it is essentially private. They obviously have some incredibly valuable and well positioned property assets which have enabled such great returns.
Many thanks and please keep posting your thoughts
James
Hello James
Thanks for the comments. Buffett once said “There is nothing like writing to force you to think and get your thoughts straight” and I agree, although I am not a patch on Buffett with my writing or investing!
With Daejan, I went to the AGM a few years ago and asked the company secretary (who confirmed the 80% shareholding) why it was kept as a public company. He said the listing instilled financial and reporting discipline to the group, which I can understand. The dominant shareholding has been a feature for years/decades and yet external shareholders have been treated well with NAV and dividend rises. If the Freshwaters were going to do the dirty on shareholders, I think they would have done so in 2008/9 and took the group private at £17 a share. The related party transactions I have not looked at closely — seems a complicated set-up and I do sense a lot of rental income is disappearing as costs (although I am not saying those costs are all back-door payments to the Freshwaters).
I will keep posting my thoughts but they won’t be very frequent — perhaps once a week.
Thanks
Maynard