20 January 2015
By Maynard Paton
I’m still ploughing through my portfolio to give each of my holdings a much-needed thorough review.
I’ve now come to Record (REC), a £75m currency-hedging business, where you may think my past share dealings have been somewhat bold.
You see, I first bought REC during December 2010 at 37p. At first the company’s updates were not that positive, so within a year I found myself averaging down at 24p — and then averaging down even more at 13p — because my sums pointed to a significantly cheaper valuation.
In fact, by April 2012 I was averaging down further at 11p and then at 10p, which luckily proved to be the bottom. From what I recall, the market was so depressed with the share, the 10p price then equalled REC’s net cash position and essentially threw the actual business in for free.
Thereafter, REC’s updates proved to be not so bad and the price has since rallied strongly. I have been top-slicing all the way, with 79% of my shareholding sold between October 2012 and February 2014 at prices between 18p and 45p.
All told, my average buy price is 15p, my average sell price is 26p and with dividends collected and a recent mid-price of 34p, I reckon I eventually doubled my money on this share after all the averaging down.
Anyway, what drew me into REC in the first place was the group’s operational niche, founder management, appealing financials and inexpensive valuation — all of which remain in place today.
At A Glance
- Provider of currency-hedging services and products for institutions
- Boardroom showcases veteran directors with significant shareholdings
- Accounts display fat margins and attractive cash generation
- Recent foreign-exchange movements may prompt greater client interest
Services are available for Passive and Dynamic clients
Record (REC) was established in 1983 and today claims to enjoy a leading position as a currency manager for financial institutions.
After starting out supplying currency-hedging services for international businesses, the group turned its attention to institutional investors during the 1990s when it launched hedging programmes for equity and bond portfolios.
REC now provides institutions with two general hedging services:
Passive Hedging: Where REC attempts to eliminate the impact of all currency movements on equity/bond prices within client portfolios.
Dynamic Hedging: Where REC attempts to eliminate only the impact of adverse currency movements on equity/bond prices within client portfolios (and thereby leave gains from favourable currency movements for clients).
In addition, from 2001, REC started to offer Currency for Return products, whereby institutions could effectively invest in the group’s currency-trading strategies in the hope of enjoying outright gains.
Unlike a traditional fund manager, REC does not handle any client money itself. Instead, the group places all of its hedging and trading contracts directly between the client and the counterparty. As such, client money is expressed by REC as “assets under management equivalent”, or AUMe.
Since 2005, REC’s AUMe has grown from $17bn to $53bn, of which $40bn is covered by standard Passive Hedging mandates. A further $10bn is related to Dynamic Hedging while $3bn is involved in Currency for Return.
Past growth has been erratic. In particular, an influx of Currency for Return clients in the latter stages of the credit boom tripled AUMe — and took operating profits from £1m to an incredible £39m — in just three years!
The boom prompted a flotation at 160p in late 2007, which in hindsight was timed perfectly.
Profits soon collapsed as the credit crunch emerged, and scores of Currency for Return clients suffered losses and jumped ship.
By 2012, the dividend had to be cut and, as I mentioned earlier, such was the market’s depression with REC’s reversal, the shares bottomed at just 10p to match the group’s net cash position.
Now that’s what I call a profit collapse
This table summarises REC’s slump since its 2007/8 heyday:
| Year to 31 March | 2008 | 2009 | 2010 | 2011 | 2012 | 2013 | 2014 |
| Sales (£k) | 66,229 | 46,796 | 33,424 | 28,196 | 20,535 | 18,552 | 19,922 |
| Operating profit (£k) | 39,266 | 25,857 | 16,392 | 12,353 | 6,554 | 5,920 | 6,424 |
| Finance income (£k) | 1,127 | 912 | 220 | 184 | 155 | 158 | 113 |
| Other items (£k) | - | - | -- | - | - | - | - |
| Pre-tax profit (£k) | 40,393 | 26,769 | 16,612 | 12,537 | 6,709 | 6,078 | 6,537 |
| Earnings per share (p) | 12.65 | 8.73 | 5.39 | 4.03 | 2.23 | 1.98 | 2.48 |
| Dividend per share (p) | 2.16 | 4.59 | 4.59 | 4.59 | 1.50 | 1.50 | 1.50 |
And this table summarises REC’s AUMe progress:
| Year to 31 March | 2008 | 2009 | 2010 | 2011 | 2012 | 2013 | 2014 |
| Dynamic Hedging ($bn) | 5.0 | 4.0 | 12.0 | 11.9 | 9.9 | 11.0 | 11.3 |
| Passive Hedging ($bn) | 18.3 | 13.0 | 13.4 | 15.7 | 18.9 | 22.1 | 37.9 |
| Currency for Return ($bn) | 29.0 | 13.4 | 7.7 | 3.4 | 1.8 | 1.6 | 2.4 |
| Other ($bn) | 3.4 | 1.1 | 0.9 | 0.4 | 0.3 | 0.1 | 0.3 |
| TOTAL ($bn) | 55.7 | 31.5 | 34.0 | 31.4 | 30.9 | 34.8 | 51.9 |
As you can see, Currency for Return AUMe is now a fraction of what it was and the lucrative performance fees such client money used to generate has long gone.
Nonetheless, Passive and Dynamic Hedging mandates have both advanced and, as far as I can tell, REC’s services here have performed as expected during the last few years. Fees from Passive and Dynamic Hedging now support the bulk of REC’s top line.
Something I should explain is REC’s reported AUMe progress can be helped (and hindered) by the wider financial markets and foreign-exchange translations.
Simply, as client portfolios rise and fall with the financial markets, so does REC’s AUMe (and its associated management fees). Plus, as AUMe is reported in US dollars (USD), client portfolios denominated in other currencies can affect the total when translated at the year-end.
The table below shows how both of these factors have combined to exceed incoming client money during the last five years:
| Year to 31 March | 2010 | 2011 | 2012 | 2013 | 2014 | TOTAL |
| Year-start AUMe ($bn) | 31.5 | 34.0 | 31.4 | 30.9 | 34.8 | |
| Net client inflow ($bn) | (3.0) | (3.6) | 0.2 | 1.9 | 14.1 | 9.6 |
| Performance ($bn) | 0.1 | (0.6) | - | - | - | (0.5) |
| Market movement ($bn) | 3.3 | (0.4) | (0.8) | 3.2 | 0.4 | 5.7 |
| Currency translation ($bn) | 2.1 | 2.0 | 0.1 | (1.2) | 2.6 | 5.6 |
| Year-end AUMe ($bn) | 34.0 | 31.4 | 30.9 | 34.8 | 51.9 |
Anyway, interim results issued in November were a standstill affair, with AUMe stuck at around $53bn, sales stuck at £10m, post-tax profits stuck at £3m and a dividend stuck at 0.75p per share.
A third-quarter update released last week then confirmed AUMe had remained at $53bn, but was expected to improve by $2bn before the end of March. REC claimed a combination of various won and lost mandates would be “modestly accretive to revenues and earnings on an annualised basis”.
Currency returns were great until the credit crunch emerged
The Q3 update also contained this management statement:
“We continue to see the return to a more divergent monetary policy environment and hence a more ‘normal’ currency market environment including the expectation of wider interest rate differentials, and stronger trends – a development that has continued since our last trading update and the subsequent announcement of our interim results.”
It’s worth re-capping the importance of “wider interest rate differentials” to REC.
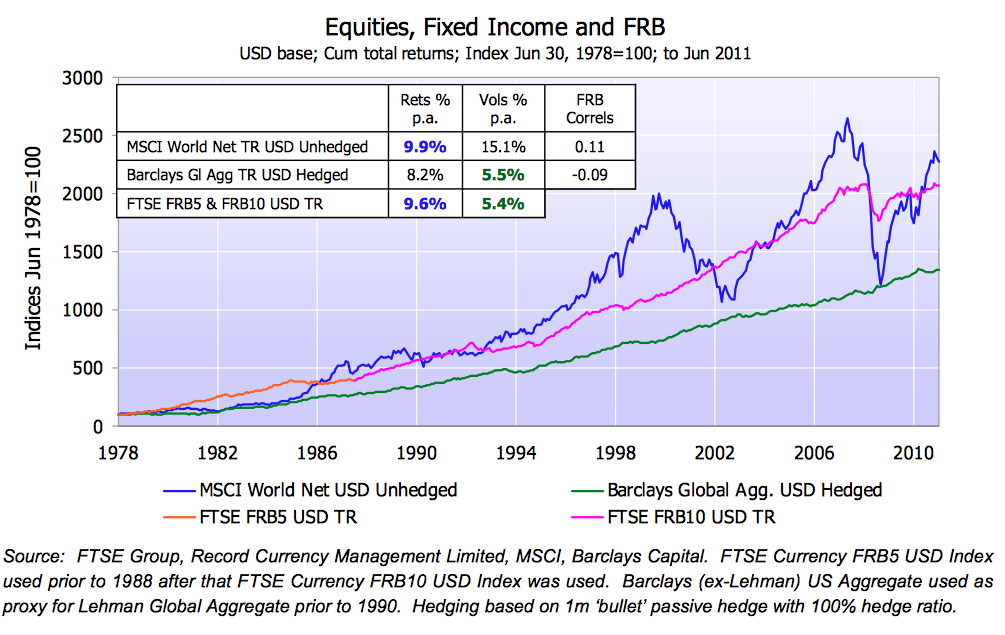
It’s all boils down to something called the Forward Rate Bias (FRB), which REC describes as “the observed tendency of higher interest-rate currencies’ returns to outperform that of lower-rate currencies”. It supports the notion of the ‘carry trade’, where traders borrow currency at lower rates (say Japanese Yen) to reinvest at higher rates (say USD) to make a return.
I’ll relieve you of the finer details, suffice to say this comprehensive PDF document published by REC explains the theory behind the FRB and why it has worked in the past.
The FRB document includes this impressive chart, which showcases the FRB’s returns between 1978 and 2011 (it’s the red/pink line):
Trouble was of course, the FRB strategy fell apart in the credit crunch and its aftermath. In particular, quantitative easing (QE) suppressed interest rates in many regions and the difference between lower- and ‘higher-’ yielding currencies narrowed considerably to eliminate any ‘carry-trade’ gains.
REC’s Currency for Return product remains centred around the FRB and it remains to be seen whether a “more ‘normal’ currency market environment” will ever establish itself. Indeed, QE has now been going since 2009!
But there are recent signs perhaps of some currency ‘breakouts’, with the USD presently at its strongest against the euro and Yen since the credit boom. Plus there was the Swiss Franc (CHF) surprise last week, when Switzerland’s national bank removed its euro peg and the CHF surged 18% against other major currencies.
I’m hopeful such strong trends and moves within the global currency markets can encourage greater demand for — or at least greater consideration of — REC’s services among institutions.
Swiss clients may have just seen their portfolios thumped
The surprise CHF move had me scurrying back to REC’s annual reports to double-check exactly how dependent the group was on Swiss clients.
Within November’s interim results, REC boasted the following CHF-based AUMe:
| Six months to 30 September 2014 | AUMe |
| Dynamic Hedging (CHF bn) | 1.6 |
| Passive Hedging (CHF bn) | 28.0 |
| Currency for Return (CHF bn) | 0.6 |
| TOTAL (CHF bn) | 30.2 |
The figures also confirmed Swiss-based clients had generated 47% of total revenue during the six months.
I had initially assumed the CHF news would be somewhat positive for REC. I mean, all of that AUMe and all those fees denominated in CHF would now be worth 18% more to REC in Sterling (GBP) terms.
But the Swiss stock market has slumped 13% since the CHF announcement, so REC’s fees from CHF-based equity portfolios will sadly decline accordingly.
REC does not disclose exactly how much Swiss clients hold in Swiss stocks, but the firm has revealed less than half of its Passive and Dynamic Hedging mandates relate to equity investments.
The rest is mostly held in bonds. which have been largely unaffected by the CHF developments — and thus have kept their value for REC’s management fees.
All told, I believe the CHF announcement should be neutral to mildly positive for REC — assuming REC’s Hedging services worked as expected during this episode.
You see, hapless Swiss clients at REC may have just seen i) their Swiss shares thumped, and; ii) the value of their foreign shares/bonds thumped when translated into CHF.
True, REC could not do anything about i), but I trust the firm’s Dynamic Hedging arrangements have protected Swiss portfolios from ii).
There has been no official word yet from REC on the effect of the CHF move. However, the company has been very quick to own up to unwelcome client news in the past and I’m assuming no news on the CHF front means it’s still business as usual.
These guys held no less than 8 remuneration meetings last year
There’s a lot to like about REC’s boardroom. Certainly it’s staffed with veteran managers with large shareholdings, which I hope bodes well for my own investment.
Founder Neil Record has run the firm since inception and today serves as executive chairman. However, he did drop down to working four days a week during 2010 after appointing James Wood-Collins as a separate chief executive.
I see in the 2014 annual report that Mr Record turned 60 last year and took about six weeks off as unpaid leave. So I do wonder whether the founder here is gradually winding down his work interests.
That said, Mr Record still retains a 32%/£24m shareholding that has barely been touched since the flotation. In fact, Mr Record cut his holding by only 15% when REC went public, which suggests he is a committed long-term holder. His annual salary is only £70,000 as well, and he no longer collects a bonus and has never owned any options.
Assisting Mr Record are fellow executives Leslie Hill and Bob Noyen, who between them own an £8m/11% stake and have held senior REC positions since 1999. Meanwhile, a new finance director was appointed the other year and helps the executives outnumber the non-execs by five to three.
Director pay has been a touchy subject at REC, which could explain why the board held no less than eight remuneration meetings last year.
Looking through past annual reports, the wages of the main executives are not exactly miserly — although I note board salaries were cut 10% the other year in light of the group’s profit slump.
Past bonuses have been somewhat generous, too
Similar to City of London Investment and Electronic Data Processing, REC operates a flat-rate bonus pool based on annual profits. REC’s scheme runs at 30% of operating profits, from which all staff and directors take their share.
In the golden year of 2007/8, the scheme paid bonuses to directors that totalled £8m. Last year the sum had dwindled to £1m.
As I have mentioned before, such flat-rate schemes have their pros and cons. They’re very straightforward and shareholders know upfront how the pool will be calculated. On the other hand, bonuses will be dished out regardless of whether profits go up or down.
I’m pleased there are not many options here. Potential dilution is about 1% after accounting for the ‘matching’ shares held in an employee trust.
REC has always boasted some very simple and appealing accounts.
One of REC’s main financial attractions is the consistently fat 30%-plus operating margin. Such high levels of profitability suggest to me this is an efficient business and its currency services enjoy a bit of a competitive niche.
Another draw is the balance sheet, which within November’s interim results carried net cash and investments of £27m, no borrowings and no pension obligations.
Plus, profits are backed fully by cash flow. Capital expenditure is minimal, while the adverse working-capital movement of 2010 was just a reversal of favourable movements in 2008 and 2009:
| Year to 31 March | 2010 | 2011 | 2012 | 2013 | 2014 |
| Operating profit (£k) | 16,392 | 12,353 | 6,554 | 5,920 | 6,424 |
| Depreciation and amortisation (£k) | 250 | 191 | 106 | 283 | 308 |
| Cash capital expenditure (£k) | (622) | (764) | (117) | (83) | (25) |
| Working-capital movement (£k) | (3,739) | 1,632 | 237 | (312) | (39) |
| Net cash and investments (£k) | 21,861 | 23,776 | 22,309 | 25,379 | 26,078 |
I also like how net cash and investments advanced by £4m between 2010 and 2014, equalling exactly aggregate reported earnings of £24m less the £20m of dividends paid out. In other words, no cash has leaked out elsewhere.
Sadly I can no longer buy REC’s shares at 10p and at net cash
It’s quite straightforward to judge REC on a possible earnings basis.
Here are my calculations.
First, I’ve derived the potential AUMe figures from last week’s Q3 statement, while the fee rates are based on those reported within November’s interims. I’ve then converted USD management fees into GBP at £1:$1.52.
| Year to 31 March 2016 (est) | AUMe ($bn) | Fee Rate | Management fee (£k) |
| Dynamic Hedging | 9.1 | 0.14% | 8,382 |
| Passive Hedging | 42.3 | 0.03% | 8,349 |
| Currency for Return | 3.1 | 0.16% | 3,263 |
| TOTAL | 19,993 |
Next, I’ve subtracted staff and other costs, plus the 30% bonus pool, using figures contained in the latest interim results:
| Year to 31 March 2016 (est) | |
| Management fees (£k) | 19,993 |
| Less staff costs (£k) | (5,800) |
| Less other costs (£k) | (4,400) |
| Less 30% profit share (£k) | (2,938) |
| Operating and pre-tax profit (£k) | 6,855 |
After standard 20% tax, my sums suggest earnings could be 2.48p per share.
REC’s market cap at 34p is £75m. Adjusting that for net cash of £27m and Pillar 1 regulatory capital requirements of £3m, I make REC’s enterprise value to be £51m or 23p per share.
Then dividing the enterprise value by my 2.48p per share earnings guess, the P/E for the underlying business comes to 9.
Meanwhile, the trailing 1.5p per share dividend supports a 4.4% income.
Here’s what could go wrong (all over again)
One obvious risk with the REC is that it’s currency strategies are all a bit ‘black box’.
True, REC has decades of complex data to underline its approach — yet none of that could stop the credit crunch seemingly curtailing the FRB and ‘carry trade’ overnight. It could be a while before clients ever come back and trust such a system again.
So I do worry about the Dynamic Hedging philosophy, which is based on REC’s own interpretation of currency ‘trends’ and ‘momentum’ — and which could also hit the rocks. So far at least this part of REC’s operation has continued to sustain clients, but it has not really been thriving.
The only part of the group that has been regularly winning client AUMe has been Passive Hedging, where the fees are much lower and the hedging approach is much simpler and (I presume) more reliable.
On the subject of lower fees, the management rate REC has charged its ‘active’ clients has dropped considerably over time:
| Average Fee Rates | 2011 | 2012 | 2013 | 2014 | H1 2015 |
| Dynamic Hedging | 0.239% | 0.200% | 0.185% | 0.16% | 0.14% |
| Passive Hedging | 0.026% | 0.029% | 0.031% | 0.031% | 0.03% |
| Currency for Return | 0.261% | 0.236% | 0.221% | 0.17% | 0.16% |
Unfortunately the business has had to lower its charges to attract more clients and I would not rule out further cuts to attract greater AUMe.
Finally, the exodus of customers a few years ago has left REC dependent on a handful of large mandates.
The latest interim results admitted one client produced 18% of revenue (it has been as high as 33%!) and the top five customers generated 60%. In the past, major clients have given REC little advance notice of leaving.
I have no immediate plans for further buying or selling
Following my hectic averaging down and then my hectic top-slicing, my residual REC shareholding has been left untouched for almost a year now.
The price has stalled around 34p, which in part reflects the current slow going at the underlying business. Yes, the client departures and profit slump now look to be in the past, but AUMe and new mandates are only inching forwards at present.
It could be a protracted recovery, but at least the wider currency markets are apparently showing very tentative signs of reverting to pre-crunch trends.
What’s more, I’m pleased the less volatile Passive Hedging division might soon become the group’s largest fee-earner, and I’m reassured the long-time executives still appear willing to steer the ship.
Meanwhile, the group’s healthy cash position should protect me on the downside and there’s a respectable yield to collect as I await further developments. I feel my single-digit P/E should offer decent upside if or when profits do revive.
Finally, I suppose there is always the outside chance that the CHF move prompts a major phase of currency fluctuations… and financial institutions beat a path to REC’s door! Well, I can hope.
All things considered, I am quite content leaving my portfolio’s REC allocation at 5% for now.
Until next time, I wish you happy and profitable investing!
Maynard Paton
Disclosure: Maynard owns shares in Record.

Having done all the research such that you are happy with the company, do you see any mileage in selling when the share price first moves against you, and then waiting for the share-price chart to show you a bottom and an uptrend before re-buying?
Perhaps a little less ‘Kamikaze’ than serious averaging down, and down, and down.
This is definitely not intended as criticism. I used to average down big time too, but now I do as described above. There’s absolutely nothing wrong with your outcome here. I just wonder if the situation caused any sleepless night?!?
So glad you’re are broadcasting — you’re my favourite guru :-)
Are you bored being at home yet? ;-)
Best,
Kevin
Hello Kevin,
Having done all the research such that you are happy with the company, do you see any mileage in selling when the share price first moves against you, and then waiting for the share-price chart to show you a bottom and an uptrend before re-buying?
I am not that type of investor. If the share price moves against me, my instinct is to look to buy more as the valuation should be cheaper — assuming the business has not deteriorated. I don’t base any decisions on charts, just valuation and company news and other fundamentals. There is nothing wrong with averaging down per se, just that it often accompanies businesses in trouble and investors generally tend to underestimate the depth of the problems and the time it takes such businesses to recover (if they ever do). You’ve just got to ensure the company’s problems are solvable and temporary. With Record, there were no sleepless nights until it rebounded strongly (twice it jumped 40% in a day) and I had the ‘worry’ of having too large a position, hence the stop-slicing began at just 18p.
I am not getting bored just yet but it is early days. This Blog lark is keeping me busy and I do look forward to getting up every morning to digging into my shares. Burford is next.
Regards
Maynard
Broker note from Edison dated 22 Jan 2015:
http://www.edisoninvestmentresearch.com/research/report/record14
This bit is reassuring:
“Record can report that it has weathered this currency storm in good shape, with its Swiss clients’ hedging strategies proving effective and no exposure to insolvent retail FX brokers.”
EPS for 2016 from Edison is 2.47p. I calculated 2.48p above.
What seems to be some promising news today:
http://www.investegate.co.uk/record-plc–rec-/rns/business-update/201503130700083408H/
“Record plc (“Record” or the “Company”), the specialist currency manager, announces today increases from an existing client to a bespoke mandate totalling approximately $1.75 billion (with AUME quoted by convention in US Dollars), fees for which are consistent with previously published average fee rates for return-seeking strategies. The increases occurred, and revenues have started to accrue, during the latter half of the current quarter. The bespoke mandate is of a tactical nature and at least part of the increases may only be temporary.”
This reads as if $1.75bn of new client AUMe has been placed into the higher-margin Currency For Return strategy. If it has, then this could be quite dramatic for near-term profits.
Revisiting my earlier sums in the post above, with £1 buying $1.50…
Currency for Return AUMe of $3.1bn + new $1.75bn = $4.85bn. Currency for Return management fees at 0.16% gives £5,173k, which added onto fees from the other two strategies gives a total of £22,127k. Less staff costs of £5,800k, other costs of £4,400k and profit share of £3,578k then gives a possible pre-tax profit of £8,349k.
Tax at 20% leaves earnings of £6,679k and EPS of 3.02p — some way ahead of the 2.48p indicated in my original post above.
EV at a 35p share price is 24p. So EV/my EPS = 8. That does not look an expensive rating, given there now seems to be some positive momentum with client AUMe — helped in part perhaps by greater currency volatility.
Today’s statement says some of the increase may be temporary, so assuming $1bn is added instead of $1.75bn, my sums indicate EPS of 2.81p per share and an EV/EPS of 8.6 at 35p.
I may have interpreted today’s REC statement all wrong, but anyway I have topped up this morning at 35p. DYOR.
Maynard
Confirmation of Q4 client AUMe:
http://www.investegate.co.uk/record-plc–rec-/rns/fourth-quarter-trading-update/201504240700351872L/
It seems the $1.75bn referred to in my comment above was indeed an increase. I am pleased with that.
Total client AUMe now $55.4bn, with some lower margin Passive Hedging funds still to arrive. My sums above were based on $56.45bn.
Anyway, revisiting my earlier sums in the post above, with £1 buying $1.51…
Currency for Return AUMe of $4.8bn gives fees of £5,086k, Dynamic Hedging AUMe of $9.2bn gives fees of £8,530k and Passive Hedging AUMe of $41.2bn gives fees of £8,185k. Less staff costs of £5,800k, other costs of £4,400k and profit share of £3,480k then gives a possible pre-tax profit of £8,121k.
Tax at 20% leaves earnings of £6,497k and EPS of 2.93p — versus 3.02p mentioned in my earlier comment. The lower calculation is due to the ‘late arrival’ of that Passive Hedging AUMe.
EV at a 34p share price is 23p. So EV/my EPS = 8. That does not look an expensive rating, given there now seems to be some positive momentum with client AUMe — helped in part perhaps by greater currency volatility.
That said, the aforementioned $1.75bn increase to Currency for Return AUMe is ‘temporary’ as per the original RNS. Exclude that $1.75bn from my sums and I still arrive at a P/E of sub-10.
A bonus in today’s AUMe update is the awarding of performance fees (£0.5m!) — the first time in 5 years! Hopefully that is the start of things to come. After the profit share, such performance fees fall to the bottom line and can bolster profits significantly. I do not include such performance fees in my sums though.
Plus, I see client numbers have advanced to 55 — the highest since September 2010. More clients, even small ones, is good news as once they are through the door they may be more amenable to take on other currency services.
I still hold REC shares.
Maynard
Hi,
I really like your blog, very well written and researched. I was wondering whether you worked in the ‘City’ as you seem to understand these asset management companies ? And the other question I have (as I’m based in Australia), how does one go about finding who a company’s shareholders are ? Over here most annual reports list the top 20.
Rgds
Christian
Hi Christian
I use to write articles for Fool.co.uk, an investment website. UK listing rules require shareholders to disclose if they own 3% or more of any quoted company. That info should be in the annual report. For AIM companies, the info should also be on the companies’ websites under ‘Rule 26’. You can track movements in shareholdings via regulatory statements issued on sites such as this: http://www.investegate.co.uk. Simply pop in your company’s ticker and then look for ‘Holdings in Company’-type statements (such as this http://www.investegate.co.uk/burberry-group-plc–brby-/rns/holding-s–in-company/201411121541278749W/)
Maynard