23 November 2016
By Maynard Paton
Quick update on Daejan (DJAN).
Event: Interim results for the six months to 30 September 2016 published 23 November 2016
Summary: These results were better than I had anticipated. Boosted in part by the weaker GBP, the commercial property group declared 6% greater rental income alongside a new all-time high for net asset value. There may be a little question mark with cash generation, but debt is still relatively low while DJAN’s seasoned management should be able to cope with any ongoing sector uncertainty. The shares trade at 59% of net asset value and I continue to hold.
Price: £57
Shares in issue: 16,295,357
Market capitalisation: £929m
Click here for all my previous DJAN posts
Results:
My thoughts:
* The typically terse text allowed the numbers to speak for themselves
This was another sparse DJAN statement that once again allowed the accounts to do all the talking.
In particular, I was impressed the group’s net asset value (NAV) rallied from almost £91 to nearly £96 per share — a new all-time high — during the six months.
I had previously wondered whether the supposed Brexit weakness in the commercial property sector had dampened DJAN’s progress. (The 2016 annual report indicated about 60% of the group’s estate was located in central or greater London.)
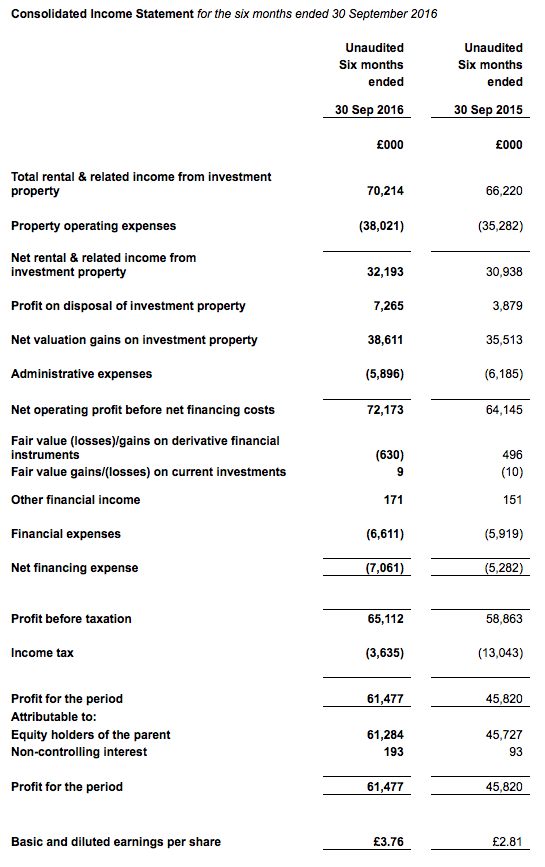
In the event, rental income gained 6% on H1 of last year — although the underlying advance was just 2.4% if you exclude the additional £2.4m rent from the United States that was due entirely to the stronger USD.
I also note H1 rental income was 2% down on the £72.0m recorded for the of last year.
Having a lower H1 rental than H2 is not unheard of at DJAN — it previously occurred in 2014, 2013, 2011, and 2010. But it does suggest rents are not going gangbusters at present.
Anyway, operating profit before property valuation gains climbed 6% to £26.3m, while property valuations gains came to a useful £39m.
In addition to the valuation gains, DJAN’s US assets enjoyed a further £20m foreign-exchange translation benefit that was recorded directly onto the balance sheet.
It’s worth noting this particular translation benefit represented £1.23 per share of the £4.99 per share NAV advance reported for the six months.
* Cash flow and balance sheet
Something I thought looked a little low was DJAN’s operational cash flow:
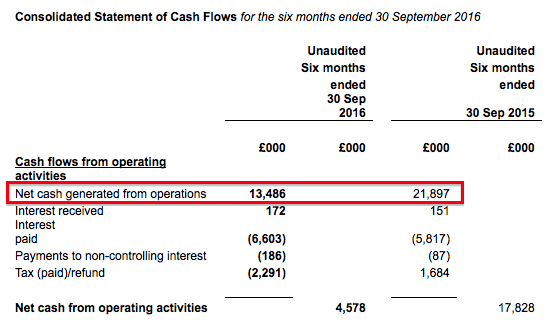
Net cash generated from operations was only £13m during the period, compared to £22m for the first half of the prior year.
I noted in the 2016 annual report that there appeared to be more outstanding rent due than normal, and I now wonder if a few tenants continue to owe DJAN money.
DJAN’s illustrious operating record — the current chairman has increased NAV 72-fold since taking charge in 1980 — does not suggest anything is too awry here with cash flow.
Nonetheless, I will need to double-check this part of the accounts within the next results, just to make sure.
The situation probably explained why the H1 dividend was held at 35p per share for the fourth year running.
In the meantime, DJAN’s debt continues to look very manageable. Total borrowings increased by £26m to £348m during H1 to represent only 16% of the £2.1bn property estate.
* Brexit and Trump
Today’s statement did mention the EU referendum and the US election in passing.
“My last annual report was written shortly after the decision had been taken for the UK to leave the European Union. Despite some positive short term indicators since that time, it is still far too soon to be able to form a balanced judgement as to what lies ahead for the UK economy as a whole and the property sector in particular.
In the USA we now have the uncertainty of a new and largely unknown President whose impact on the USA economy and the property sector cannot be foreseen at this stage.
Against this background we will continue to pursue our long term, low risk approach to creating growth in net asset value.”
DJAN confirmed its US operation carried net assets of £244m (£14.97 per share) at the half-year-end, and I calculate subsequent currency movements have added £10m (61p per share) to that valuation.
Valuation
Trading at £57, the shares represent 59% of the latest £96 per share NAV. That discount looks sizeable to me.
As I mentioned in my last write-up, another way of looking at DJAN’s value is from a return on equity standpoint.
During recent 10-year periods, DJAN has earned at least 8% a year from its asset base.
So… assuming DJAN can continue to earn an average of 8% a year from its £96 per share asset base, typical annual earnings would be £7.66 per share — represented by a mix of rental profit and valuation gains.
In theory at least, enjoying £7.66 per share a year from a £57 entry price is equivalent to a worthwhile 13% annual return.
Maynard Paton
Disclosure: Maynard owns shares in Daejan.
