06 July 2016
By Maynard Paton
Quick update on Daejan (DJAN).
Event: Preliminary results for the year to 31 March 2016 published 06 July 2016
Summary: I have no complaints about these figures. Rental income and operating profit advanced significantly to new all-time highs, while further valuation gains helped the property group’s balance sheet reach a record £91 per share. Debt remains relatively low and I’m trusting DJAN’s veteran management will be able to take full advantage of any ructions in the post-Brexit property market. The shares trade at 53% of net asset value and I continue to hold.
Price: £48
Shares in issue: 16,295,357
Market capitalisation: £782m
Click here for all my previous DJAN posts
Results:
My thoughts:
* An extremely sparse commentary, but the figures spoke for themselves
DJAN’s statements are among the most terse within the stock market. These were actually record results, yet carried only the following two paragraphs of management narrative:
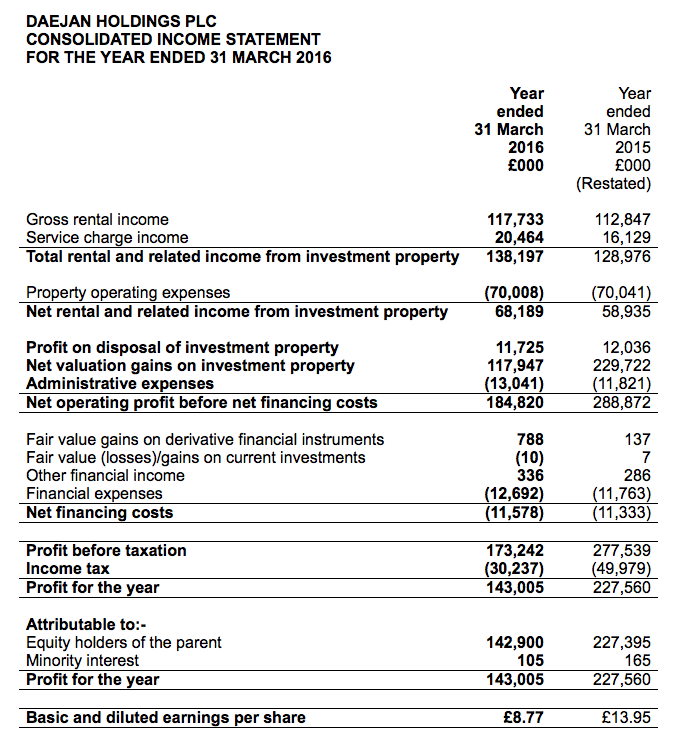
“The revaluation of the investment property portfolio at the year end has resulted in a net valuation surplus for the year of £117,947,000 (2015 – £229,722,000). The board has recommended a final dividend of 58p per share in respect of the year ended 31 March 2016 payable on 11 November 2016 to shareholders on the register on 14 October 2016. This will make a total dividend for the year of 93p (2015 – 88p).”
“Earnings per share is calculated by reference to profit on ordinary activities after taxation attributable to equity holders of the parent of £142,900,000 (2015 – £227,395,000) and 16,295,357 (2015 – 16,295,357) ordinary shares being the weighted average number of ordinary shares in issue during the year.”
The forthcoming 2016 annual report will provide more details on the group’s progress. But for now at least, the figures thankfully spoke for themselves.
Total rental and related income advanced 7% to £138m, although adjusted for an £8m one-off rent settlement enjoyed in 2015, the underlying gain was an impressive 14%.
Meanwhile, operating profit before property disposals and valuation gains climbed a splendid 17% to £55m.
Valuation gains came to £118m, equivalent to 6.4% of the value of DJAN’s property estate at the start of the year, and pushed the estate’s year-end value to beyond £2bn.
The gains helped net asset value (NAV) improve by 10% to almost £91 per share, as well as support a 6% lift to the dividend.
The 2016 figures extended DJAN’s positive progress witnessed since the banking crash:
| Year to 31 March | 2012 | 2013 | 2014 | 2015 | 2016 |
| Net asset value (£k) | 862,033 | 984,870 | 1,110,468 | 1,345,818 | 1,480,025 |
| Net asset value per share (p) | 5,290 | 6,044 | 6,815 | 8,259 | 9,082 |
| Revenue (£k) | 107,094 | 111,037 | 112,202 | 128,976 | 138,197 |
| Operating profit (£k) | 27,923 | 33,084 | 32,863 | 47,114 | 55,148 |
| Profit on property disposal (£k) | 16,254 | 6,612 | 11,320 | 12,036 | 11,725 |
| Net valuation gain (£k) | 15,683 | 82,694 | 119,648 | 229,722 | 117,947 |
| Finance expense (£k) | (11,636) | (11,094) | (11,129) | (11,763) | (12,692) |
| Other items (£k) | (6,375) | 391 | 11,803 | 430 | 1,114 |
| Pre-tax profit (£k) | 41,849 | 111,687 | 164,505 | 277,539 | 173,242 |
| Earnings per share (p) | 221 | 550 | 919 | 1,395 | 877 |
| Dividend per share (p) | 76 | 79 | 82 | 88 | 93 |
A particular highlight from the latest numbers was the operating margin.
Operating profit before property disposals and valuation gains represented 40% of total rental and related income — the highest DJAN has recorded since 2003.
* Balance sheet shows conservative financial position
DJAN’s balance sheet continues to look robust.
Capital expenditure for the year was a relatively modest £26m, which allowed net debt to drop by £15m to £237m.
In fact, total borrowings of £322m continue to represent about only 16% of DJAN’s £2bn property estate. Furthermore, interest costs of £13m appear well covered by the £55m operating profit.
It all suggests the group sports a conservative financial position and ought to enjoy a wide margin of safety should rents and valuations start to wobble. I also trust DJAN’s veteran management will be able to employ greater borrowings if property bargains do appear.
* Brexit
The statement said nothing directly about Brexit, but the accounting small-print did contain the following (my bold):
“The valuation of the Group’s property portfolio is inherently subjective, depending on many factors, including the individual nature of each property, its location and expected future net rental values, market yields and comparable market transactions.
Therefore the valuations are subject to a degree of uncertainty and are made on the basis of assumptions which may not prove to be accurate, particularly in periods of difficult market or economic conditions following the EU Referendum.
All the Group’s properties are valued by external valuers with appropriate qualifications and experience.”
These results also confirmed DJAN owned net assets with a £221m (£13.56 per share) value in the United States.
Currency movements since the March year-end will now make the group’s US portfolio more valuable in Sterling terms, although acquiring new properties in the States will presumably become more expensive with the weaker pound.
Valuation
Trading at £48, the share price is equivalent to 53% of the latest £91 per share NAV. That looks a healthy discount to me.
As I mentioned in my original write-up, another way of looking at DJAN’s value is from a return on equity standpoint.
During recent 10-year periods, DJAN has earned at least 8% a year from its asset base:
| 10yrs to 2012 | 10yrs to 2013 | 10yrs to 2014 | 10yrs to 2015 | 10yrs to 2016 | |
| Start NAV (£) | 27.17 | 28.81 | 30.96 | 38.94 | 45.74 |
| End NAV (£) | 52.90 | 60.44 | 68.15 | 82.59 | 90.82 |
| Dividends accumulated (£) | 6.80 | 7.04 | 7.28 | 7.55 | 783 |
| Total return (£) | 32.53 | 38.67 | 44.47 | 51.20 | 52.91 |
| Total return/Start NAV (CAGR %) | 8.2 | 8.9 | 9.3 | 8.8 | 8.0 |
Assuming DJAN can earn an average of 8% a year from its latest £91 per share asset base, typical annual earnings would be £7.27 per share — represented by a mix of rental profit and valuation gains.
In theory at least, enjoying £7.27 per share a year from a £48 share price is equivalent to a generous 15% annual return.
Maynard Paton
Disclosure: Maynard owns shares in Daejan.

Daejan (DJAN)
Publication of 2016 annual report:
http://www.daejanholdings.com/perch/resources/reports/167483daejanholdingsplcra2016-web.pdf
The terse narrative within the original results RNS means there are a few points to note here.
1) Brexit
“Those who advocated leaving the EU…” oh dear — it appears DJAN’s management voted Remain in the EU referendum:
“…will not be good for our UK business” does not sound great.
The risks section underlines the ‘uncertainty’:
Meanwhile, the outlook section did suggest development work was continuing, albeit at a slower pace:
I note other works are in progress, though:
Overall, I must admit this 2016 report did not reveal as much as past reports have in terms of building developments in progress.
2) Property revaluations
This snapshot confirms that each of DJAN’s property divisions reported valuation gains:
3) Director pay
I see the executive directors enjoyed a pay rise, this time 10% to £1.1m each:
Chairman Benzion Freshwater has seen his basic pay advance 8.3%pa in the last five years and 7.1%pa in the last ten.
In contrast, the dividend is up about 4% pa during the last five and ten years, while NAV is up 10.9%pa in the last five and 7.9%pa in the last ten.
So I think the wage hikes have been generally justified, though a £1.1m basic salary does look very hefty regardless of the size of the business.
Still, I can’t argue with management’s track record and if £1m-plus salaries are required to keep the record going, then that’s something shareholders have to live with.
Note that the board does not collect bonuses and does not enjoy pension contributions. Nor is there any option scheme.
4) Trade receivables
I see outstanding trade receivables came to £36m — representing 26% of the £138m revenue figure:
If tenants pay quarterly then perhaps having 26% of rent etc unpaid is normal. But previous years have seen that proportion almost always below 20%, which is why I am noting this year’s movement. At least the majority of unpaid debtors are not past due.
5) Cost of fixed-rate mortgages
It’s nice to see DJAN’s fixed-rate mortgages shuffle towards lower rates of interest:
The group paid interest of £13m during 2016, which on average debt of £313m = a 4.1% interest rate. The cost for 2014 and 2015 were 3.8% and 3.9% respectively. The small increase comes from DJAN taking on more fixed-rate than floating debt, the latter I presume (the report does not confirm) carries a lower rate of interest at present.
6) Effect of weak pound on balance sheet
DJAN reported US net assets (i.e. property less loans etc) of £180m and said the year-end GBP:USD rate was 1.44.
DJAN also said the USD weakening 10% against GBP would erode £20m from the balance sheet:
GBP now buys 1.31 USD, which I reckon means the £180m net US assets are now worth £180m * 1.44 / 1.31 = £198m. So an extra £18m, which divided by 16.3m shares = £1.22/share.
Maynard
Maynard,
can I ask which do you favor between Mountview and Daejan and can I challenge you on why hold both?
The only action I took post Brexit was to hastily sell MTVW which now I regret!
Best
David
Hello David
Well, if forced to hold only one I would probably plump for Mountview as it is a pure residential property business. Daejan’s commercial property portfolio includes secondary retail assets, which may not produce the greatest sector returns in the future. I hold both as they both offer time-tested management with owner-orientated attitudes, conservative financing, illustrious track records and what I believe to be modest valuations.
Maynard
Maynard,
Good answer! I’m looking for a entry point to get back in to MTVW
Regards’
David