23 October 2015
By Maynard Paton
Today I’m revealing my latest share investment.
The company in question is Castings (CGS), a long-established iron castings and machining group that’s based in the Midlands.
You may recall that, back in September, I added Castings to my watch list.
Well, after mulling over that write-up, I then bought in at an average price of 426p including all costs. The bid price is now 440p and the holding currently represents about 8% of my portfolio.
When I invested, I felt this £188m firm offered many traits of a respectable investment.
Important attractions for me included a durable dividend, an asset-flush balance sheet, improving productivity, good-value management and an upbeat immediate outlook. What’s more, a possible P/E of 11 suggested the shares were priced quite modestly.
However, I recognised CGS was by no means a one-way bet. Obvious risks include serving a small number of large customers and a recent profit history that has seen its ups and downs.
At A Glance
* Designer and manufacturer of iron castings
* Cash-rich accounts have ensured dividend has never been cut since at least 1992
* Risk-averse executives remain confident about near-term trading
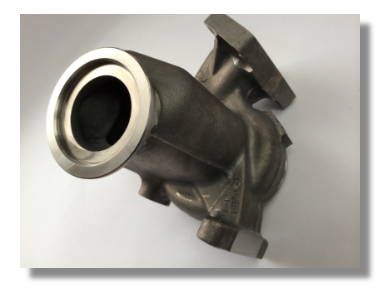
Steering knuckles, brake shoes and turbo housings
Castings (CGS) was established during 1907 and I have the impression it has been designing and manufacturing iron castings ever since. The group is now the country’s largest foundry operator.
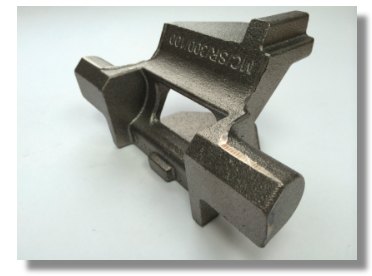
These days Castings is best known for supplying the commercial vehicle industry with products such as differentials, steering knuckles, brake shoes and turbo housings. I understand major customers include Scania, DAF and BMW. The group also makes brackets, shoulders and assemblies for rail networks.
I must admit to not having any special insight into CGS’s manufacturing process or competitive position.
But for what it’s worth, the company’s website says the group produces ductile iron castings, spheroidal graphite iron castings, austempered ductile iron castings, Simo castings and Ni-resist castings of up to 40kg in weight using four Disamatic moulding machines and three horizontal Green Sand moulding machines.
Furthermore, the 2015 annual report states the firm is “always mindful of [its] competitor activity and invests in the latest technology to maintain [its] market advantage.”
Such state-of-the-art facilities, alongside “world-class technical expertise” — as well as (presumably) price, service, reputation and product quality — have all helped ensure shareholders have collected a very reliable dividend during the last two decades.
Perhaps the best explanation of CGS’s facilities is contained within this video…
…which showcases the forging process and the group’s ladles, furnaces, pattern plates, moulding boxes and auto-grinders. The film is certainly worth 3m54s of your time.
You can also find full details of CGS’s facilities for yourself on the group’s website.
The dividend has never been cut since at least 1992
I don’t know when CGS floated, but Companies House supplies annual reports stretching back to 1995. The archives show that, during 1991, the group reported revenue of £24m, a pre-tax profit of £4m and a dividend of 1.9p per share.
By 2015, revenue had reached £131m, pre-tax profit was £17m while the dividend had advanced to 13.3p per share.
The growth rate over time has generally been modest, with the expansion seen during the last five years partly reflecting the group’s recovery from the banking crisis:
| 5 years to 2015 | 10 years to 2015 | 15 years to 2015 | 20 years to 2015 | |
| Revenue CAGR | 16.7% | 6.6% | 5.9% | 4.9% |
| Operating profit CAGR | 12.9% | 7.5% | 4.3% | 4.7% |
| Dividend per share CAGR | 5.9% | 4.2% | 4.2% | 7.1% |
CGS’s progress has not been entirely smooth. Revenue and underlying profit essentially stagnated at c£60m and c£9m respectively between 1997 and 2005, while the banking crash caused profit to halve during 2009.
The table below shows setbacks also occurring during 2013 and 2015, due mainly to legislative-driven demand for certain vehicle parts that created bumper sales in 2012 and 2014.
| Year to 31 March | 2011 | 2012 | 2013 | 2014 | 2015 |
| Revenue (£k) | 101,368 | 126,271 | 122,215 | 137,466 | 131,268 |
| Operating profit (£k) | 14,991 | 22,244 | 18,702 | 21,286 | 17,386 |
| Other items (£k) | 352 | 693 | 149 | 363 | 24 |
| Finance income (£k) | 158 | 156 | 306 | 184 | 137 |
| Pre-tax profit (£k) | 15,501 | 23,093 | 19,157 | 21,833 | 17,547 |
| Earnings per share (p) | 26.7 | 40.3 | 33.9 | 39.6 | 31.8 |
| Dividend per share (p) | 10.8 | 11.8 | 12.3 | 13.0 | 13.3 |
Nonetheless, the dividend has made dependable advances. It was raised every year between 1992 and 2008, after which it was held for two years. The payout has since been lifted every year.
I’m particularly encouraged how CGS’s results have not been blighted by exceptional items. The largest one-off charges occurred during 2009, when the group lost £4m held in Icelandic banks and had to spend £2m on redundancy payments. Subsequent exceptional items have related to money recovered from the failed Icelandic banks.
I’m also pleased there has been little in the way of acquisition activity. The last deal was completed in 1996 and cost only £150k.
The latest results showed lower profit, but other stats were promising
Annual figures published in June showed revenue down 5% and operating profit down 19%. But the results narrative provided some hope for the current 2016 financial year (my bold):
“The work mix at William Lee has increased in complexity which has impacted profitability in the year and necessitated greater harmonisation of production methods across the group. Following some senior personnel changes, the new management team have addressed the production issues that arose and good progress has been made.”
“We have invested £3.9 million during the year to accommodate new orders and will continue to do so as and when the order book grows further. In the current year, the [machining] business expects to benefit from the commercial vehicle market increases in line with the foundry operations and for volumes from other markets to remain strong.”
“In general we are now experiencing improved volumes from many of our customers and it is anticipated profits will increase providing the recovery continues.”
One positive from the results was the steadily improving quality of revenue from CGS’s foundry division. The table below shows how the value of each tonne of castings dispatched has increased slightly during recent years:
| Year to 31 March | 2009 | 2010 | 2011 | 2012 | 2013 | 2014 | 2015 |
| Foundry revenue (£k) | 83,111 | 58,077 | 97,163 | 117,036 | 106,674 | 119,893 | 113,300 |
| Dispatched weight of castings (tonnes) | 43,900 | 31,800 | 50,600 | 57,200 | 52,700 | 57,600 | 52,700 |
| Revenue per casting (£/tonne) | 1,893 | 1,826 | 1,920 | 2,046 | 2,024 | 2,081 | 2,150 |
It is also worth noting that CGS dispatched 53,500 tonnes of castings during 2007, a year when total revenue was £86m. In contrast, a similar dispatched tonnage in 2015 produced total revenue more than 50% greater.
These employee ratios since the pre-crash peak of 2007 have also been encouraging:
| Year to 31 March | 2007 | 2015 |
| Revenue per employee (£k) | 87,101 | 116,579 |
| Total employee cost/revenue (%) | 36.4 | 31.3 |
Elsewhere, the group’s specialist machining division continues to impress. Revenue here has surged more than ten-fold since 2009 and margins last year were a super 25%:
| Year to 31 March | 2011 | 2012 | 2013 | 2014 | 2015 |
| Machining revenue (£k) | 8,205 | 9,235 | 15,541 | 17,563 | 17,968 |
| Machining operating profit (£k) | 3,410 | 4,017 | 3,803 | 5,187 | 4,521 |
The latest statement from CGS emerged during August. The company’s AGM update re-confirmed the positive outlook (my bold):
“Following the statement in the Chairman’s report in June, it is pleasing to report sales volumes are still improving in particular in the commercial vehicle sector. We see no change in the foreseeable future and provided there is no adverse economic and world news it is expected profits will improve on last year’s level.”
I’m hoping there will be a trouble-free handover
Something to bear in mind with CGS is that the group’s aforementioned dividend record was stewarded by Brian Cooke, who first took on the lead executive job during 1970 — but retired from executive duties earlier this year.
As such, I am having to trust the new chief exec can carry on where Mr Cooke left off.
At least the omens for a trouble-free handover are positive. In particular, current boss David Gawthorpe joined the firm in 1984, became a director in 2003 and was appointed chief exec in 2007. Importantly, he also boasts a technical product background and presumably offers plenty of relevant (and hands-on) work experience.
Mr Gawthorpe is in his 50s, too, so another retirement handover is not an obvious worry at present.
I would not say Mr Gawthorpe is overpaid for running a business that has just delivered an annual £17m operating profit. During 2015 he collected a £244k basic wage and an £82k bonus.
True, you could question why Mr Gawthorpe enjoyed a bonus when operating profit fell19%. However, CGS bases its director bonuses on how far operating profit tops £10m. I like this incentive simplicity, but it does mean the board could collect extra cash during times when the business treads water.
(Anyway, past annual reports reveal the directors hold only one remuneration meeting a year — so it is not as if the execs are always discussing costly new pay schemes!)
I have mixed feelings about the board’s own shareholdings. On the one hand, Mr Cooke continues to hold a 4%/£8m stake, which has been largely unchanged since at least 1994. So I hope he, now as non-exec chairman, can continue to keep the execs in line on behalf of all shareholders.
However, the four executives that are left to run the business hold a combined shareholding currently worth about £200k — which is not a great endorsement for incoming investors.
At least the remaining executives can work without an option scheme (I see share count has not changed since 2003.)
Cash in the bank plus an impending pension refund
The most impressive part of CGS’s accounts is the asset-flush balance sheet.
At the last count, the books carried cash of £30m (70p per share), no debt and (mostly freehold) land and buildings with a £26m (60p per share) accounting value.
The books also contain a defined-benefit pension scheme that has reported a funding surplus every year since 2007. Notably the scheme’s trustees have agreed to refund £5m (11p per share) of the current £14m surplus back to CGS.
Within the income statement, the past five years have seen operating margins bounce between 13% and 18% and average 15.2%. For the last ten years, the average has been 14.6%.
Though not spectacular, such levels of profitability appear quite respectable, given CGS supplies powerful vehicle manufacturers that are not known for their generosity.
Return on average equity (ROAE) calculations appear respectable, too.
Strip out the group’s cash from the denominator and I make the 2015 ROAE figure to be £13.9m/£86.2m or 16%. The previous four years witnessed 19% or more, while the ten-year average is about 17% (all adjusted for the cash position).
Perhaps hindering CGS’s ROAE figures has been the company’s expenditure on land and buildings — about £16m during the last five years alone.
Such assets do not tend to produce wonderful ROAE numbers over the short term, but they do tend to hold their value and prevent nasty surprises from rising lease costs.
Such asset expenditure does mean CGS is a capital-intensive business… with a mighty £47m spent on property, plant and equipment since 2011. Nonetheless, I am happy the associated £32m depreciation charge adequately reflects the ongoing expenditure on new machinery, with the difference being the aforementioned property purchases:
| Year to 31 March | 2011 | 2012 | 2013 | 2014 | 2015 |
| Operating profit (£k) | 14,991 | 22,244 | 18,702 | 21,286 | 17,386 |
| Depreciation (£k) | 5,606 | 6,188 | 7,416 | 6,046 | 6,760 |
| Net capital expenditure (£k) | (9,892) | (12,591) | (6,846) | (9,659) | (8,138) |
| Working-capital movement (£k) | (5,361) | (3,393) | (3,644) | (16) | (4,095) |
| Net cash (£k) | 13,707 | 17,805 | 23,654 | 27,780 | 30,021 |
On the working-capital front, changes in stock, debtor and creditor levels since 2011 have absorbed almost £17m — which is a sizeable amount when aggregate operating profit during the same time came in at £95m.
Mind you, my ratio calculations for stock turn and debtor days do not reveal any alarming trends. Indeed, the working-capital movements have not stopped CGS from paying dividends of £25m and adding £15m to its cash pile during the last five years.
I thought the shares were valued quite modestly when I bought at 426p
Here’s how I decided it was worth investing at 426p.
I took the 2015 operating profit of £17.4m and applied tax at the 20% standard UK rate, which gave me earnings of £13.9m or 31.9p per share.
I then subtracted the £30m, or 70p per share, net cash position from the then £186m market cap, to arrive at an enterprise value (EV) of £156m or roughly 356p per share.
The potential P/E on my EV and EPS estimates was therefore 356p/31.9p or 11.2
Going on the latest AGM comments, I thought it would be fair to assume earnings could improve 5% during 2016. Such progress would then lower my possible P/E to 10.6.
For what it is worth, the house broker reckons current-year earnings could jump to 38p per share:
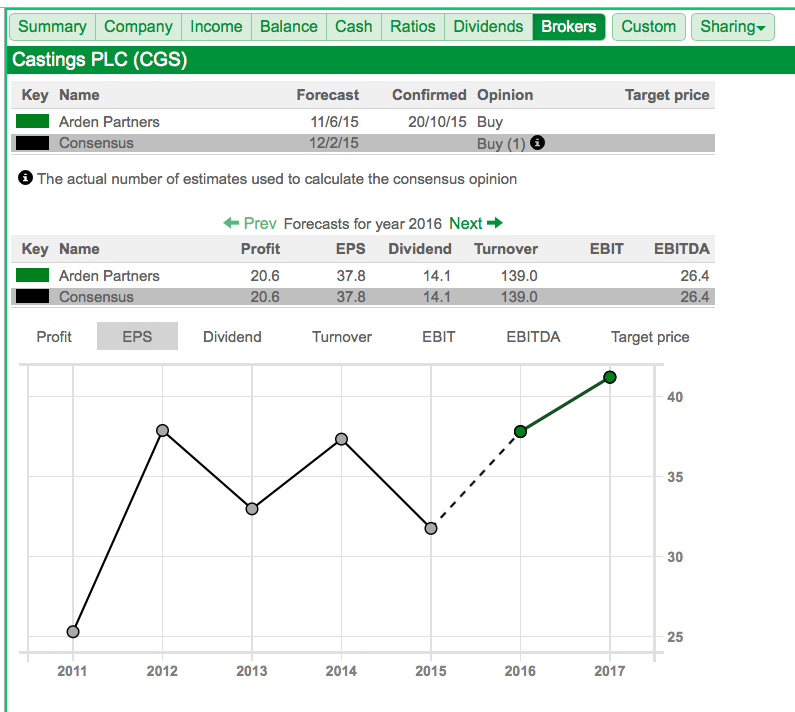
Source: Sharepad
Meanwhile, the trailing 13.3p per share dividend supports a 3.2% income.
A small number of large customers
Alongside the aforementioned management change, I see two other main risks with this investment.
First and foremost, CGS is dependent on a small number of large customers. For the last four years, about 47% of annual revenue has come from just three clients:
| Year to 31 March | 2011 | 2012 | 2013 | 2014 | 2015 |
| Customer 1 (% Revenue) | 22.7 | 22.3 | 23.7 | 24.6 | 25.4 |
| Customer 2 (% Revenue) | 11.2 | 14.6 | 13.6 | 11.8 | 12.1 |
| Customer 3 (% Revenue) | * | 9.6 | 10.4 | 11.3 | 7.6 |
| Total | 33.8 | 46.5 | 47.7 | 47.7 | 45.1 |
| Other (% Revenue) | 66.2 | 53.5 | 52.3 | 52.3 | 54.9 |
(* — not disclosed)
Mitigating the danger of an important customer leaving, CGS states it aims to build “long-term supply relationships” with all of its clients through “state-of-the-art design and flexible production offerings”.
However, I get the impression CGS has to sustain very high standards of service — and offer it at a competitive price — to keep the customers happy.
Another possible setback here could emerge from energy costs and metal prices.
In the past, CGS has highlighted higher electricity bills and the greater cost of steel scrap as creating “uncertainty” for the business.
You see, rising UK utility costs could give overseas rivals an advantage, while CGS says there is “always a delay” when recovering rising input costs from customers.
For now at least, I am pleased electricity prices appear stable and that commodity prices in general have fallen.
A rewarding mix during the next few years?
I wrote in my watch-list review that companies with distinguished track records and reasonable valuations were quite a rare combination in the current market. I thought CGS offered such features and, on further reflection, I decided to buy.
True, this is not the most glamorous of investments… and it will certainly not multi-bag in the next few years. It may even disappoint, especially if one of those large customers departs or the remaining managers decide to ditch the successful operating approach of ex-leader Brian Cooke.
For now, however, I see a relatively straightforward business blessed with substantial asset backing, recent productivity gains, upbeat current trading and a valuation that does not appear outlandish. There are no cast-iron guarantees of course, but I’m hoping for rewarding returns during the next few years.
Until next time, I wish you happy and profitable investing!
Maynard Paton
Disclosure: Maynard owns shares in Castings.

Thanks for great analysis Maynard. Do you care about historical P/E levels, or industry p/e levels or do you have “ideal” p/e in mind when purchasing such stock?
Hello Ondra
Thanks for the comment. I do look at past P/Es to gauge what investors have paid in the past, but such figures are of course influenced by how the company was performing back then — and other factors such as the general level of the market etc. I ignore sector P/Es as such figures lump in all sorts of businesses and you are never sure how the figures are compiled with loss-making outfits elsewhere.
My simple rule of thumb is to buy respectable companies on good-value ratings and hold for the long run. Depends on the company, but 10-11 for Castings looks good value to me. Anything in single digits really starts to get my attention, although such situations are rare and are very rare at present. For top-quality firms, I could be prepared to pay something like 12-13 earnings — opportunities can occur when such firms see their profits stagnate due to wider economic issues. But again such opportunities are very rare right now.
Right now a lot of investors are prepared to pay 20x-plus for quality shares, and they have done well in the last few years. But I continue to believe it is easier for a share to re-rate from 10 to 15, than it is for a share to re-rate from 20 to 30, and give the same 50% ‘status change’ to the investor.
Maynard
Castings and forgings are ‘like’ knickers and spoons. It’s just not a good pun.
CGS is an excellent company (blown away when I visited). Time to buy is when its market is on the up and its market is pretty mundane.
Comparison with GDWN is interesting because it’s higher-tec. Steel: now that is difficult to cast. Iron – easy peasy.
That’s the trouble with an accountant’s view of a company:-)
apad
ps
I think your blog is excellent (no irony).
Thanks apad