12 February 2015
By Maynard Paton
Quick update on City of London Investment (CLIG).
Event: Half-year results published 11 February.
Summary: Figures already heralded by January trading statement — therefore no surprises. Previous guidance all repeated. Still on course to pay 24p per share dividend and support 7% dividend yield at 335p. Vague hints of dividend increase now emerging. Cash position remains high. P/E remains modest. I continue to hold.
Price: 335p.
Shares in issue: 26,861,207
Market capitalisation: £90m
Results:

My thoughts:
* Gross fee income edged almost 4% higher due to greater funds under management (FUM). But something to watch — the management fee rate on average FUM during the period was the lowest for at least six years:
| Six months to | Start FUM (£m) | Close FUM (£m) | Average FUM (£m) | Gross fee income (£k) | Fee/FUM |
| Nov 2008 | 2,400 | 1,400 | 1,900 | 10,445 | 1.10% |
| Nov 2009 | 2,200 | 2,900 | 2,550 | 13,780 | 1.08% |
| Nov 2010 | 3,000 | 3,600 | 3,330 | 17,195 | 1.04% |
| Nov 2011 | 3,500 | 3,000 | 3,250 | 17,232 | 1.06% |
| Nov 2012 | 2,900 | 2,400 | 2,650 | 15,135 | 1.14% |
| Nov 2013 | 2,400 | 2,100 | 2,250 | 11,786 | 1.05% |
| Dec 2014 | 2,300 | 2,600 | 2,450 | 12,204 | 1.00% |
(Note: this trend may be distorted by CLIG’s rounded FUM figures).
* Commissions relating to the legacy marketing agreement continue to decline — down £361k to £1.2m. Below is CLIG’s latest run-off prediction:

Those future payments discounted at 10% annually would cost a total of £6.4m today at £1:$1.53.
* Other administrative expenses fell £341k to £1.4m. Nice.
* But staff costs advanced £314k — 30% of all cost savings effectively flow to staff through the 30% employee profit-share scheme.
* Operating margins improved to 34%, exceeding the level seen during financial years 2012, 2013 and 2014. Nice.
* Cash and investments reduced from £11.5m to £9.5m following £4m final dividend payment and £1m share purchase for the employee benefit trust (EBT).
Something to watch — cash movements relating to the EBT and share options can be significant from time to time:
| Year to 31 May | 2007 | 2008 | 2009 | 2010 | 2011 | 2012 | 2013 | 2014* |
| Issue of own shares (£k) | - | - | 167 | 126 | 343 | 5 | 68 | 16 |
| EBT share purchase (£k) | (671) | (1,591) | - | (731) | (1,527) | (514) | (519) | - |
| Proceeds from EBT (£k) | 114 | 352 | 178 | 294 | 414 | 137 | 169 | 27 |
(*13 months to June 2014)
During the last eight full years as a quoted company, CLIG has spent close to £6m and received more than £2m in relation to the EBT and share options. It works out at around £400k net cash expenditure a year.
* Helpful post-tax profit/FUM model table remains unchanged:
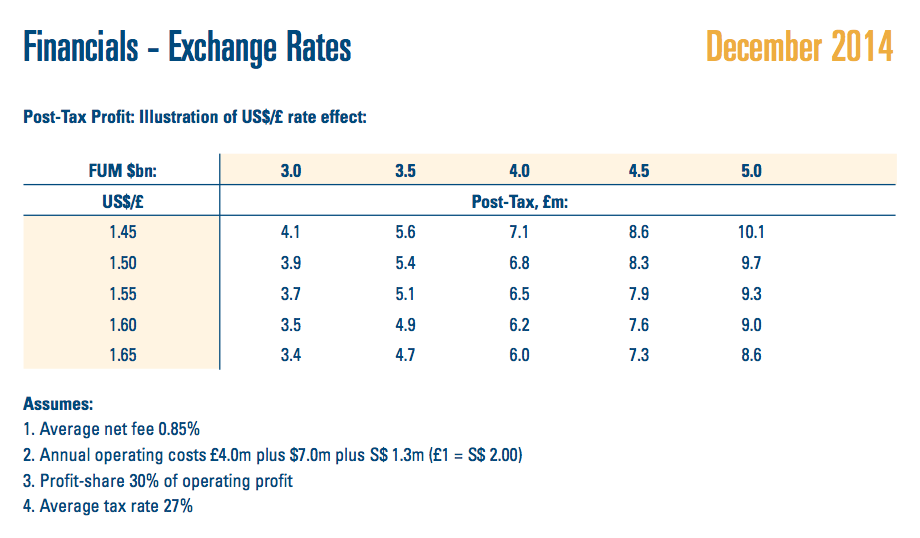
Latest FUM of $4bn and £1:$1.53 gives possible earnings of £6.6m or 24.6p per share on total share count.
* “Forward guidance” unchanged:
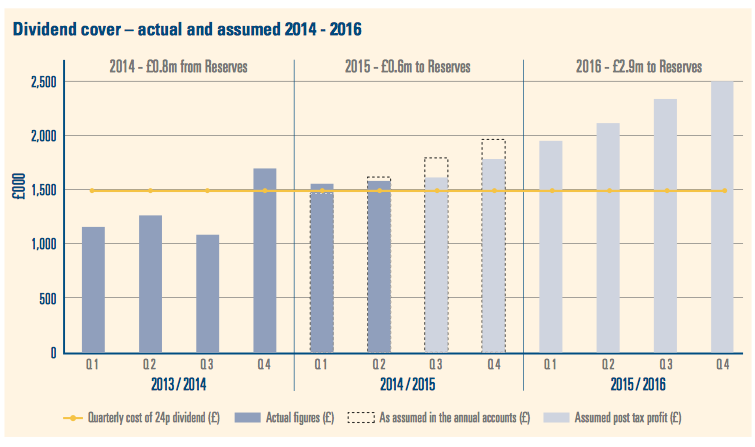
2016 projection of “£2.9m to reserves” indicates earnings of £8.8m (£5.9m dividend plus £2.9m surplus) or 32.9p per share on total share count.
* Doubling up half-year earnings just reported gives 25.2p per share — enough to cover current 24p per share dividend and support 7% yield.
* Vague hints of future dividend lift from management (my bold):
“In view of the improvement in profitability, your Board has no difficulty at this time in paying a maintained 8p interim dividend”
“In a better market environment, plus of course a few new mandate wins we could consider this challenging period as being behind us and look to better days and the potential for an increased dividend.”
Management repeated its revised dividend cover target of 1.2x based on rolling five-year average. 1.2x current 24p payout gives earnings of 30p — could happen if aforementioned 2016 forward guidance achieved.
Valuation
* My estimate of surplus net cash and investments less regulatory capital requirements is £8.3m or 31p per share. Enterprise value (EV) is thus £82m or 304p.
* Using post-tax profit/FUM model, underlying P/E on EV is 12.4
(Although using post-tax profit/FUM model and adding back current commission costs could give earnings of £8.2m or 30.3p per share. Add £6.4m discounted commission value to EV gives £88m, which suggests underlying P/E of 10.8).
* Using 2016 forward guidance, underlying P/E on EV is 9.2.
Shares go ex-div on 19 February and 8p interim dividend paid on 6 March. Next update 8 April — Q3 FUM.
Until next time, I wish you happy and profitable investing!
Maynard Paton
Disclosure: Maynard owns shares in City of London Investment.

I don’t think there is much doubt about their intention to raise the dividend “Our job now is to increase the dividend via Diversification and to sustain investment performance” from their Investor presentation http://www.citlon.co.uk/shareholders/share_reports/IP33.pdf
Q3 update today: http://www.investegate.co.uk/city-of-lon-inv-grp–clig-/rns/interim-management-statement/201504080700055417J/
FUM up from $4.0bn at the end of January to $4.2bn at the end of March.
Using the helpful post-tax profit/FUM table highlighted in the above post, FUM of $4.2bn and a £:$ rate of 1.49 gives potential earnings of £7.44m or about 28.0p per share (vs 24.6p per share stated in the above post)
My estimate of surplus net cash and investments less regulatory capital requirements remains at £8.3m, or 31p per share. Enterprise value (EV) at a 335p share price is thus £82m or 304p.
Using the post-tax profit/FUM model, the underlying P/E on EV is 11.0
CLIG also revealed today that its run-rate of operating profit before profit share was £1.2m a month. Less profit share of 30% and tax at 27%, earnings could be £7.36m or 27.4p per share. On the same EV basis, the P/E comes to 11.1.
On these sums and the dividend policy referred to in the above post , a maintained 24p per share dividend continues to appear likely.
Maynard
CLIG’s website has revealed a further uplift to AUM:
http://www.citlon.co.uk/shareholders/announcements.php
AUM about $4.4bn, versus $4.2bn at the end of March:
However, that AUM uplift has been negated somewhat by the pound strengthening against the dollar. £:$ is now 1.54 versus 1.49 used in the sums within the reply above.
So, using the helpful post-tax profit/FUM table highlighted in the above post, FUM of $4.4bn and a £:$ rate of 1.54 gives potential earnings of £7.69m or about 28.6p per share (vs 24.6p per share stated in the above post and vs 28.0p stated in the above reply)
My estimate of surplus net cash and investments less regulatory capital requirements remains at £8.3m, or 31p per share. Enterprise value (EV) at a 345p share price is thus £84m or 314p.
Using the post-tax profit/FUM model, the underlying P/E on EV is still 11.0
CLIG’s website has revealed a small decline to AUM:
http://www.citlon.co.uk/shareholders/announcements.php
AUM about $4.3bn, versus $4.4bn at the end of April:
Using the helpful post-tax profit/FUM table highlighted in the above post, FUM of $4.3bn and a £:$ rate of 1.53 gives potential earnings of £7.47m or about 27.8p per share (vs 24.6p per share stated in the above post and vs 28.6p stated in the above reply)
My estimate of surplus net cash and investments less regulatory capital requirements remains at £8.3m, or 31p per share. Enterprise value (EV) at a 350p share price is thus £86m or 319p.
Using the post-tax profit/FUM model, the underlying P/E on EV is now 11.5.
Maynard