UNOFFICIAL
SharePad Guide:
Daily Market Movers
Last updated: 31 August 2020
By Maynard Paton
Welcome to part 5 of my UNOFFICIAL SharePad guide for new subscribers!
This page describes how to create a list column to quickly sort the day’s largest risers and fallers, as well as sort the largest movers for the last five days and since the start of 2020.
Before you start!
My instructions below adjust the default Equities – Overview column layout in step 1. I use this default and I recommend you do as well to start with. The original columns can be restored and other list views can be created at a later date.
My instructions also create three columns, which show the share-price percentage changes for:
* the day;
* the last 5 trading days, and;
* since the start of 2020.
If you just want the largest risers and fallers of the day, then skip over the optional steps 5, 6, 7 and 8.
Official SharePad Tutorials: Columns
Disclosure: This blog page contains SharePad affiliate links.
Just follow these instructions:
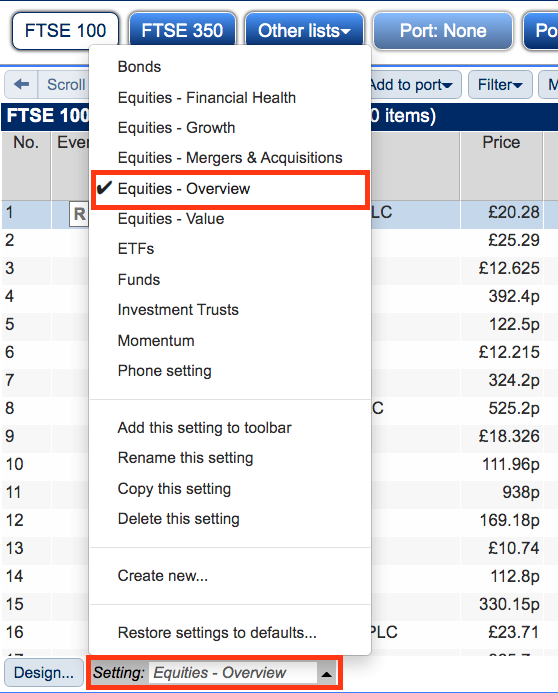
1) Click on Setting at the bottom and select the appropriate column list view:
2) Click Add column… within the blue sub-menu:
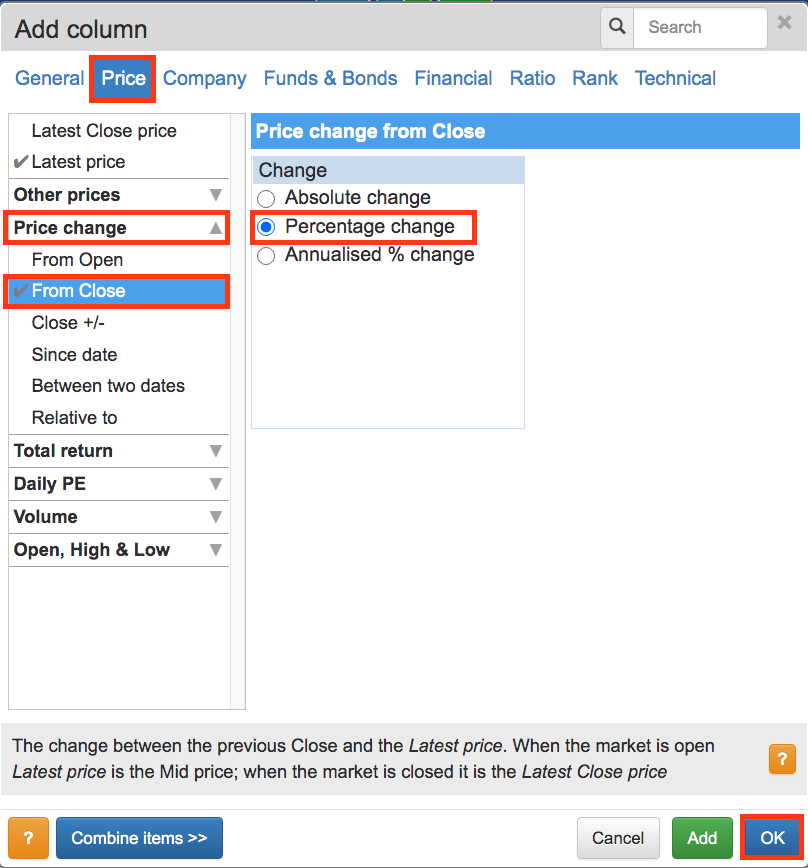
3) The Add column box will appear:
Within the Add column box:
- Select Price within the top menu.
- Open the Price change drop-down menu and select From Close.
- Select Percentage change.
Then click OK.
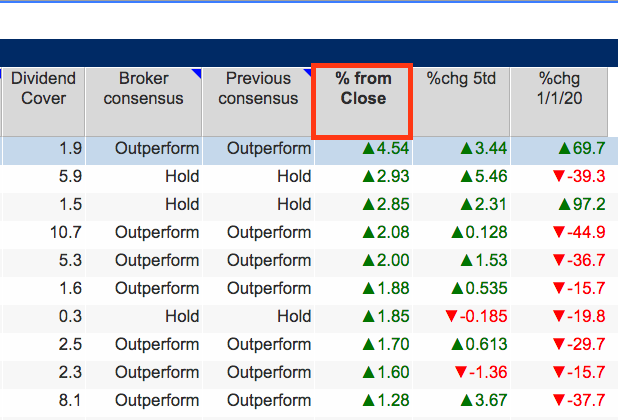
4) An extra column will now appear on the right:
5) Optional: Click Add column… within the blue sub-menu:

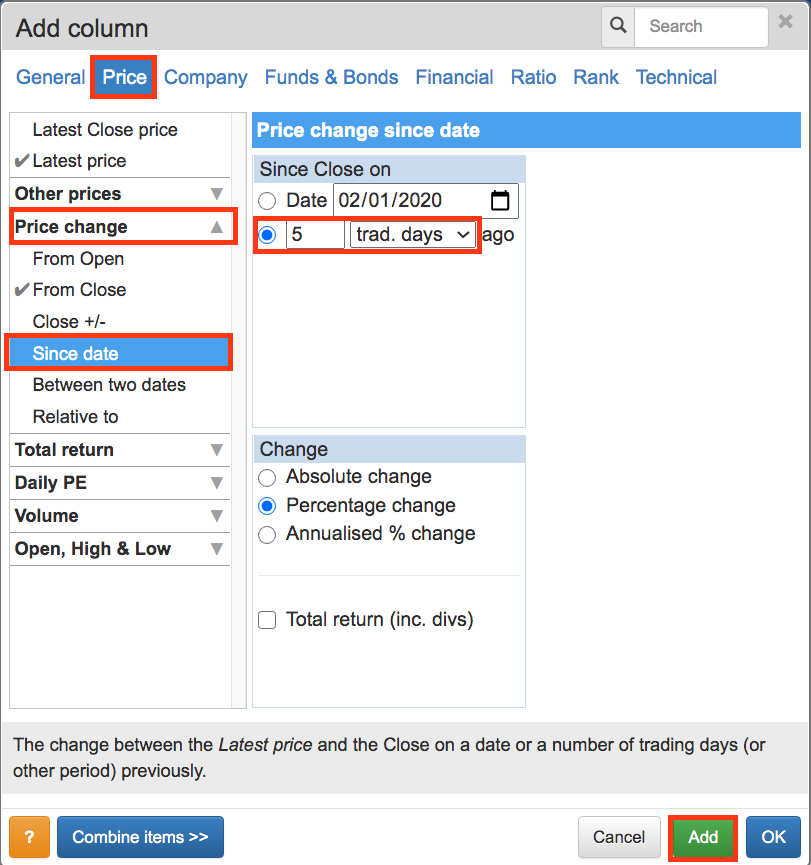
6) Optional: The Add column box will appear.
Within the Add column box:
- Select Price within the top menu.
- Open the Price change drop-down menu and select Since date.
- Enter 5 and the select trad. days. (feel free to enter a different number and timescale)
Then click Add.
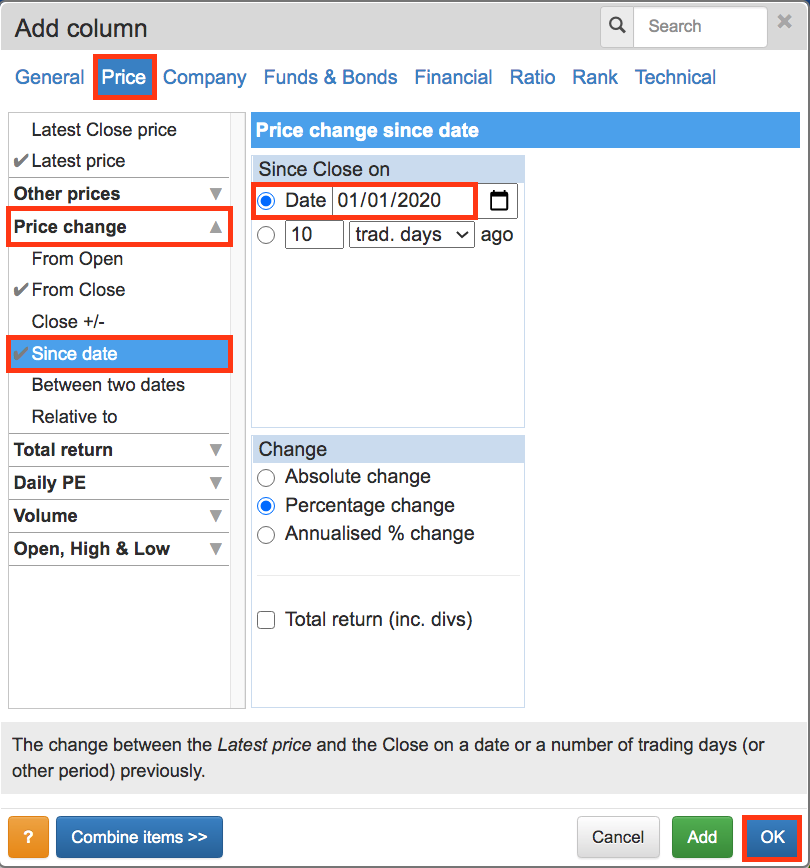
7) Optional: The Add column box will re-appear:
Within the Add column box:
- Select Price within the top menu.
- Open the Price change drop-down menu and select Since date.
- Select Date and enter 01/01/2020 (feel free to enter a different date)
Then click OK.
8) Optional: An extra two columns will now appear on the right:
9) Double-click the header to sort the column showing the day’s largest risers:
Double-click the header again to sort the column in reverse order showing the day’s largest fallers.
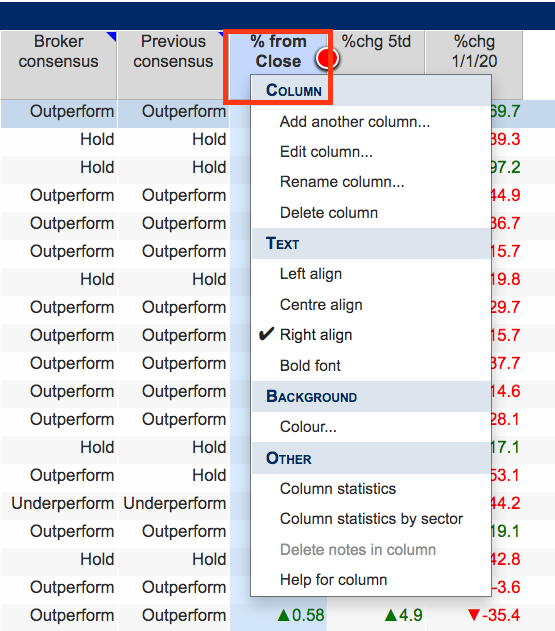
10) Right-click the column header to set further column settings:
11) With the column selected (red circle showing), click the Move arrows to re-arrange the position of the new column:
Click Deselect within the blue sub-menu to deselect the new column and remove the red circle.
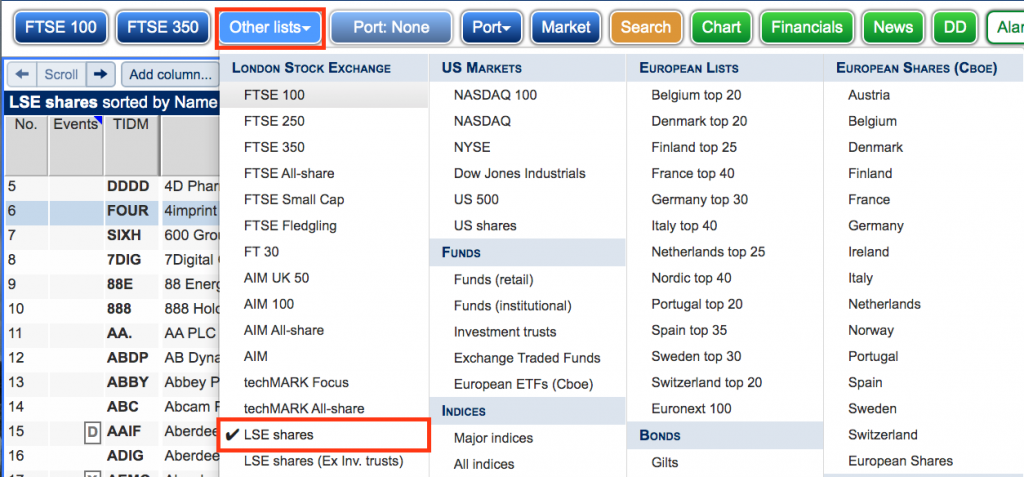
13) The number of risers and fallers listed in the column will depend on which list (or index) you have set. You may wish to change the list to widen or narrow the number of risers and fallers:
14) All done!
Further guide links:
- Introduction
- Part 1: Creating A Portfolio and Setting Up RNS Email Alerts
- Part 2: Designing Your SharePad Summary
- Part 3: Installing Stock-Screening Filters
- Part 4: Installing Financial Charts
Happy investing with SharePad!
Maynard Paton
