UNOFFICIAL
SharePad Guide:
Summary Dashboard
Last updated: 27 August 2020
By Maynard Paton
Welcome to part 2 of my UNOFFICIAL SharePad guide for new subscribers!
This page describes how to custom design the company Summary dashboard, and the settings I find useful.
Official SharePad Tutorial: Using the stock dashboard
Disclosure: This blog page contains SharePad affiliate links.
Just follow these instructions:
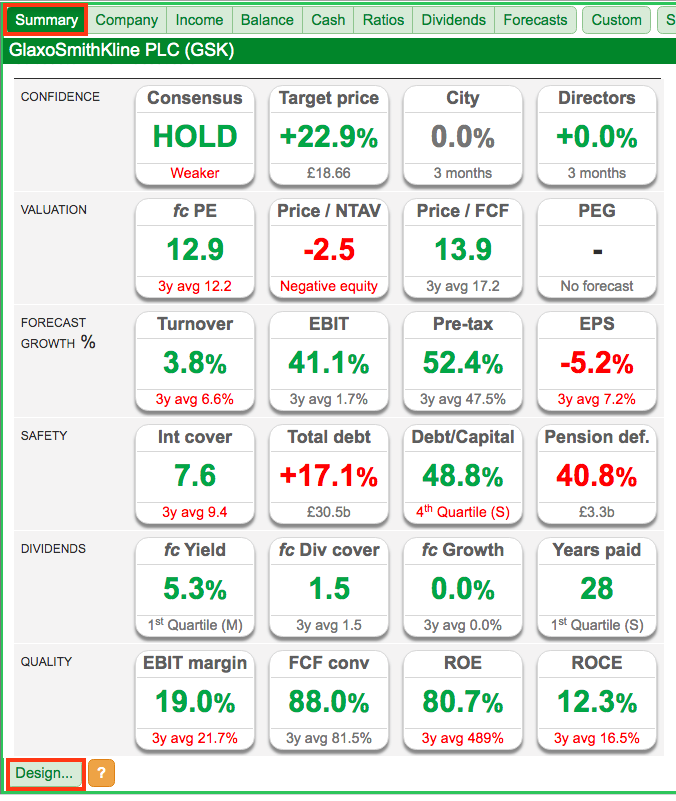
1) Click Summary within the green sub-menu and then click Design:
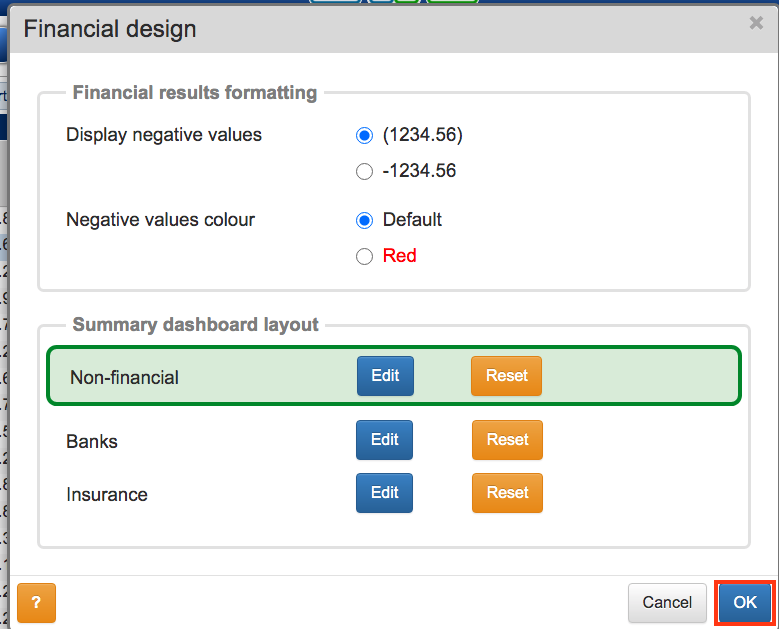
2) The Finance design box will now appear. Click Edit for Non-financial:

(Note: The Financial results formatting can be left alone. Unless you wish to invest in banks and insurers, the other layouts can be ignored as well).
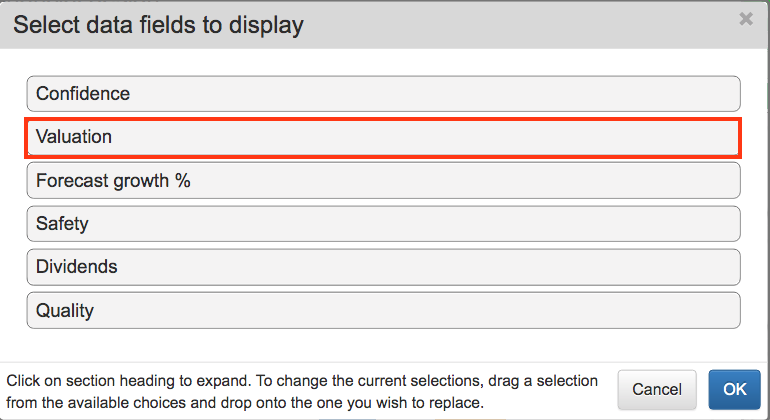
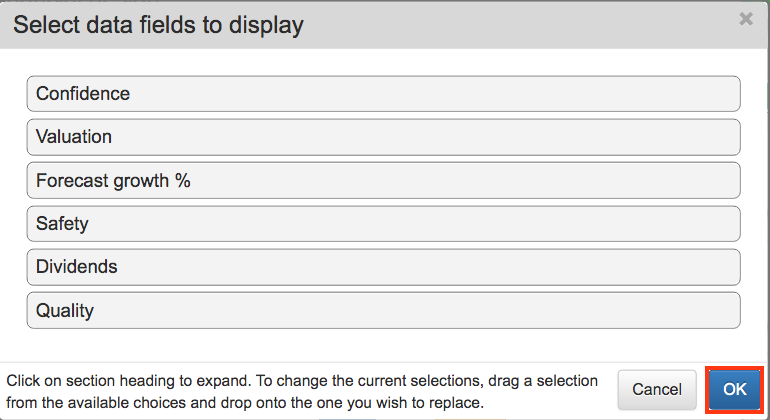
3) The Select data fields to display box will now appear:
Now click on any of the six rows to adjust that row’s settings:
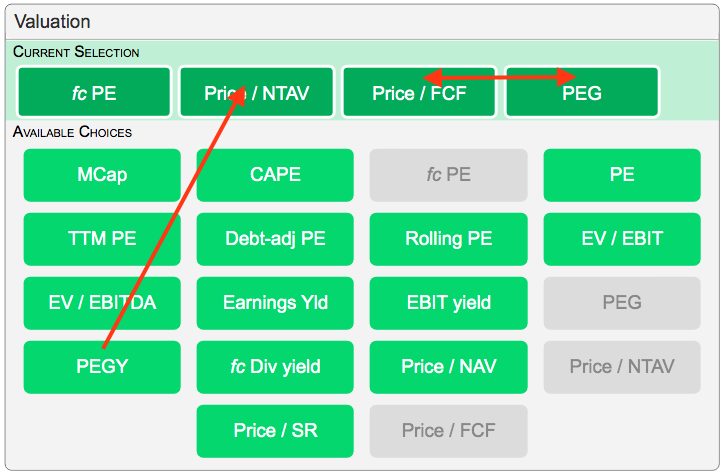
To change a setting, simply drag one of the Available Choices onto a Current Selection. Current Selections can be re-ordered by dragging one over another:
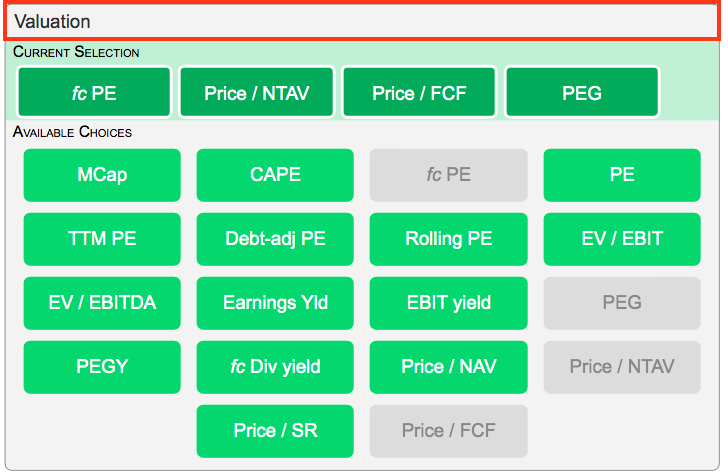
Click on the row again to close the settings:
4) I use the following settings:
Confidence:
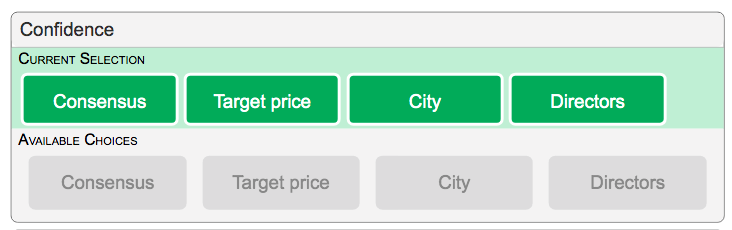
- Confidence has only four available choices, so we’re all stuck with the same settings.
- I find the Directors box the most useful on this row, as it highlights director share-trading from the previous three months.
Valuation:
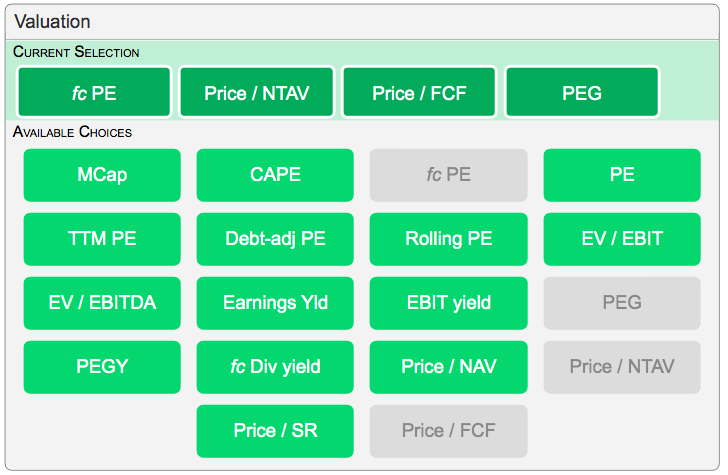
- Quite a few choices here. I go for forecast PE as all the other PE variations use historical data, although debt-adjusted PE is sometimes helpful.
- I use Price/NTAV to evaluate the occasional asset play and Price/FCF as a comparison for the PE to judge cash flow. I include PEG, but never study it.
- I have never used EBIT or EBITDA for valuation purposes, while the forecast dividend yield can be selected in a different Summary row.
Forecast growth %:
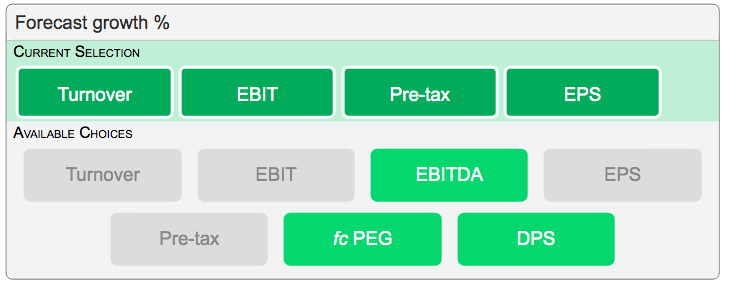
- I use Turnover, EBIT, Pre-tax and EPS, as I never bother with EBITDA, do not use PEG ratios and set DPS growth in a different Summary row.
Safety:
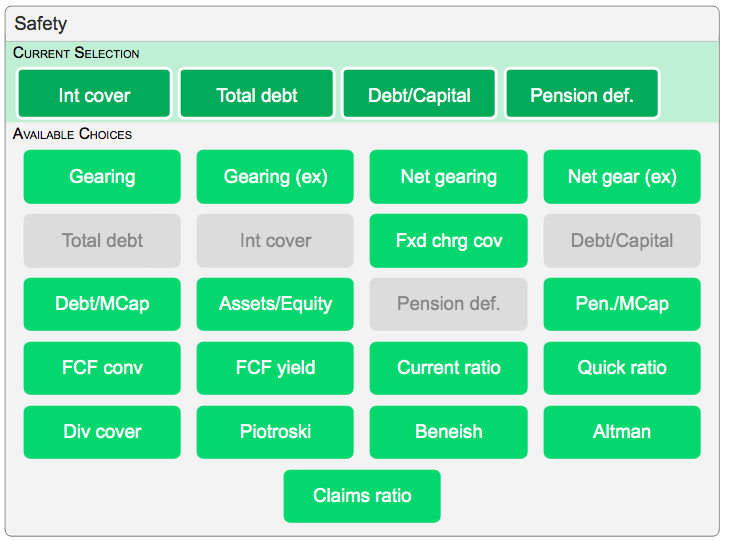
- Lots of options here, although not all are that useful.
- I include Interest cover as it is the only selection available that includes profit in the calculation. After all, profit is what pays the interest charges and eventually repays the borrowing. Indeed, SharePad really should swap one of the many gearing ratios for a profit versus debt measure.
- I look at Total debt and Debt/Capital to get a sense of the size of the company’s borrowings.
- I use Pension deficit, but this value should be compared to profit as well to judge the scale of any scheme shortfall.
- The Current and Quick ratios are calculations of a bygone era and are not that relevant to how many businesses operate today.
- Piotroski, Beneish and Altman are short-hand ‘red flag’ indicators that in my view provide a false sense of security.
- The market cap ratios to debt and pension deficit have never made sense to me.
- The FCF conversion and FCF yield options can be selected in a different Summary row.
Dividends:
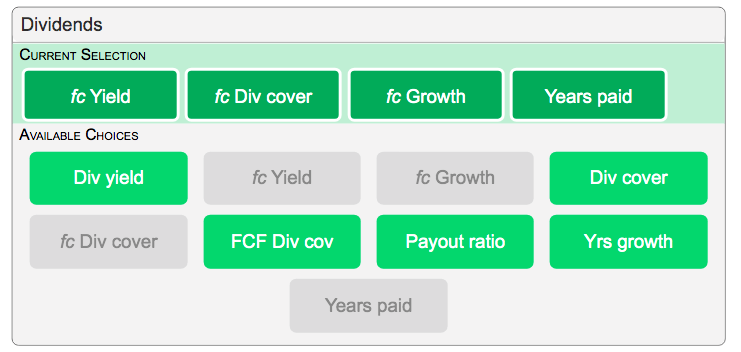
- I prefer the forecast yield, cover and growth options as they look forward and not back.
- I go for Years paid, but Years growth could be just as useful.
- The payout ratio is simply the inverse of dividend cover.
Quality:
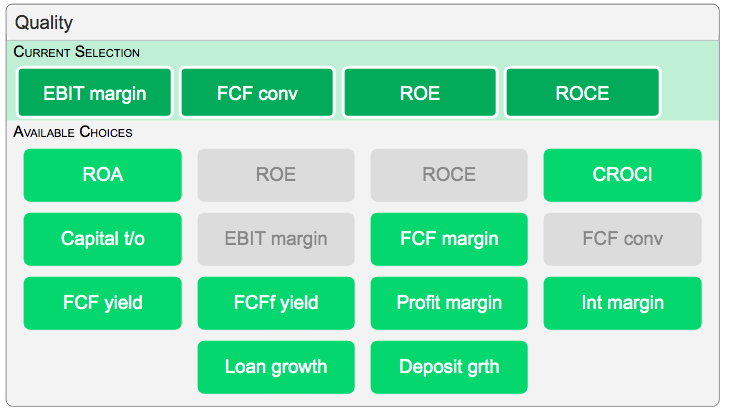
- This final row is the most insightful of the six.
- I like companies with high profit margins, so I use EBIT margin but could use profit margin instead.
- I use FCF conversion to judge whether earnings are backed by cash flow.
- I use ROE and ROCE to check whether suitable returns are being generated, and significant differences between these two figures could indicate substantial levels of debt.
- I have never really calculated ROA but recognise this ratio could be practical.
- I don’t bother with cash return on capital invested (CROCI), as if earnings are backed by cash the result should be similar to ROE and/or ROCE.
- I don’t use the other FCF ratios as they won’t mean much if the FCF conversion is poor.
- Loan growth, deposit growth and Interest margin are all bank ratios that I ignore.
5) Once you have adjusted your Summary settings, click OK:
The Financial design box should re-appear. Then click OK:
6) All done!
I should add that I occasionally tweak my Summary set-up depending on the type of business. For example, I might want to look at one of the gearing ratios for a property company.
Further guide links:
- Introduction
- Part 1: Creating A Portfolio and Setting Up RNS Email Alerts
- Part 3: Installing Stock-Screening Filters
- Part 4: Installing Financial Charts
- Part 5: Finding The Market Largest Risers and Fallers
Happy investing with SharePad!
Maynard Paton