This week I am tracking down a potential long-term winner by employing two ratios favoured by ‘quality’ investors.
The first measure is operating margin, which represents the percentage of sales converted into profit.
In theory, a company exhibiting a high operating margin may enjoy pricing power over customers — which in turn may indicate a strong competitive advantage and perhaps relatively predictable earnings.
The second measure is return on equity, or ROE, which is calculated by dividing earnings by the shareholder equity used to produce those earnings.
A company with a high ROE does not have to retain and reinvest too much profit to generate attractive rates of growth. As such, lots of spare cash can be left over for dividends — or so the theory goes.
Opinions vary as to what constitutes an attractive operating margin and ROE.
I consider 20% or more to be quite special.
Let’s see what I can find on SharePad.
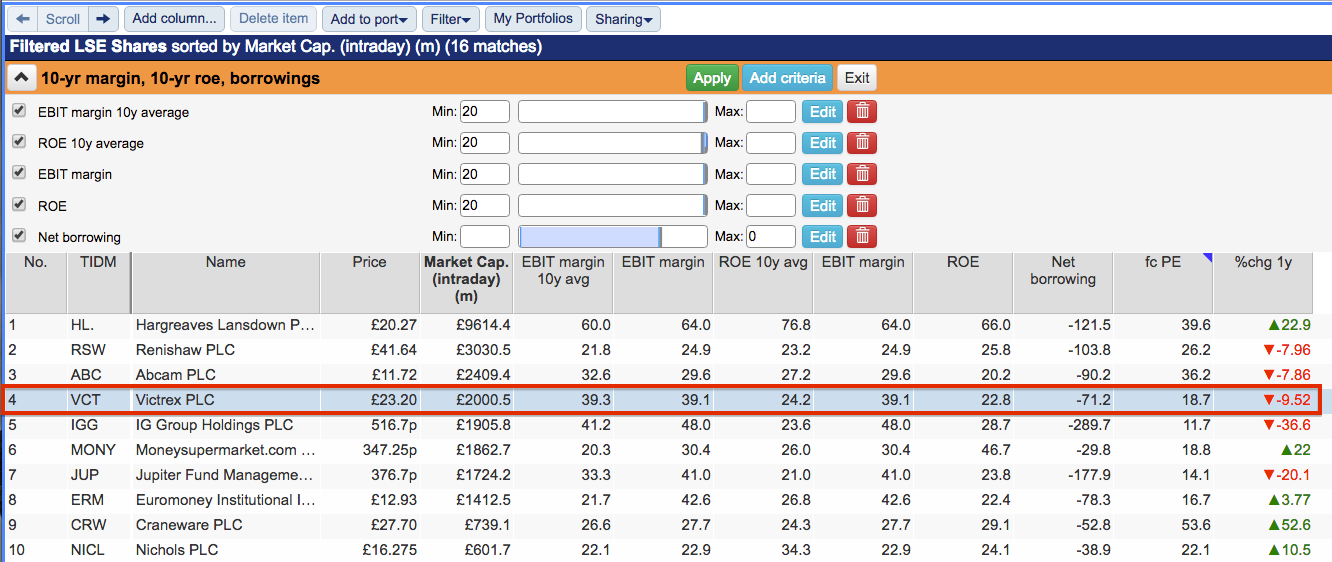
A shortlist of 16 names
For this search I used SharePad to identify companies that exhibited:
1) An operating margin (latest and 10-year average) of 20% or more, and;
2) An ROE (latest and 10-year average) of 20% or more.
To narrow the field down further, I also filtered for companies that carried net borrowings of less than zero (i.e. net cash):
(You can run this screen for yourself by selecting the “Maynard Paton 25/04/19: Victrex” filter within SharePad’s super Filter Library. My instructions show you how.)
SharePad returned 16 companies, three of which I have studied previously: Hargreaves Lansdown, Renishaw and Craneware.
I plumped for Victrex because this share had one of the lower P/Es on the list and its price had fallen during the past twelve months.
Margin, ROE and share price
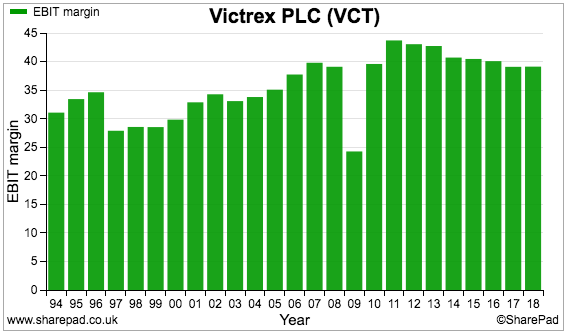 Let’s first check Victrex’s margin history:
The operating margin has always exceeded 20% and has generally topped 30% and sometimes even 40%. The business appears to be extremely lucrative.
True, Victrex’s ROE has reduced over time:
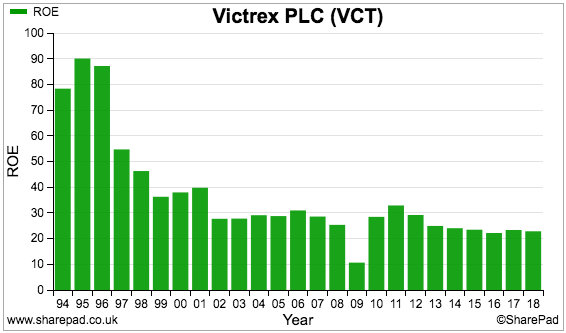
However, the figure has stabilised above the 20% mark and underlines the notion of a very productive operation.
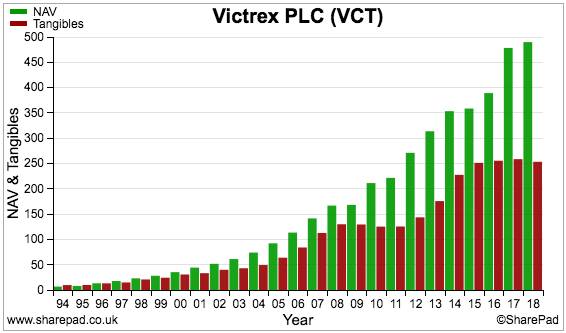
Sustaining a 20%-plus margin and ROE has unsurprisingly delivered a wonderful long-term share price:
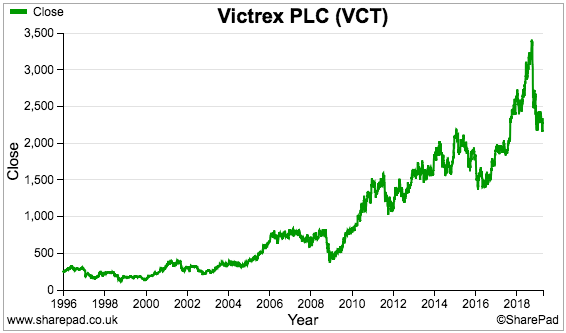
The shares have indeed come off the boil during the last twelve months. The recent price is approximately a third lower than the £34 high witnessed last September. Victrex’s market cap is currently £2 billion.
A rather downbeat statement was issued during February:
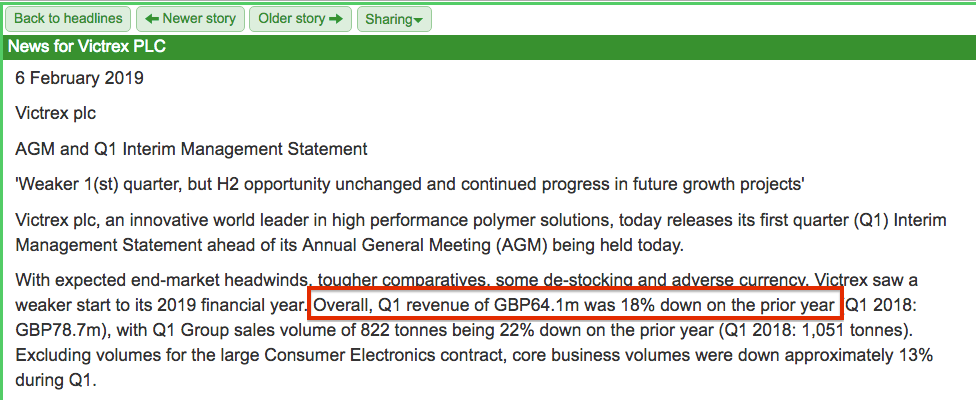
Victrex admitted first-quarter revenue had slumped 18% — which does seem surprisingly poor for a business that has exhibited superior margin and ROE ratios for so long.
The history of Victrex
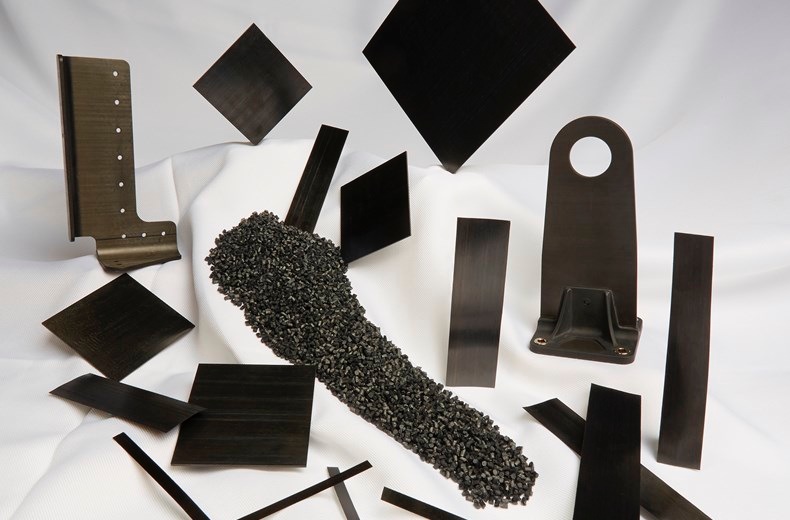
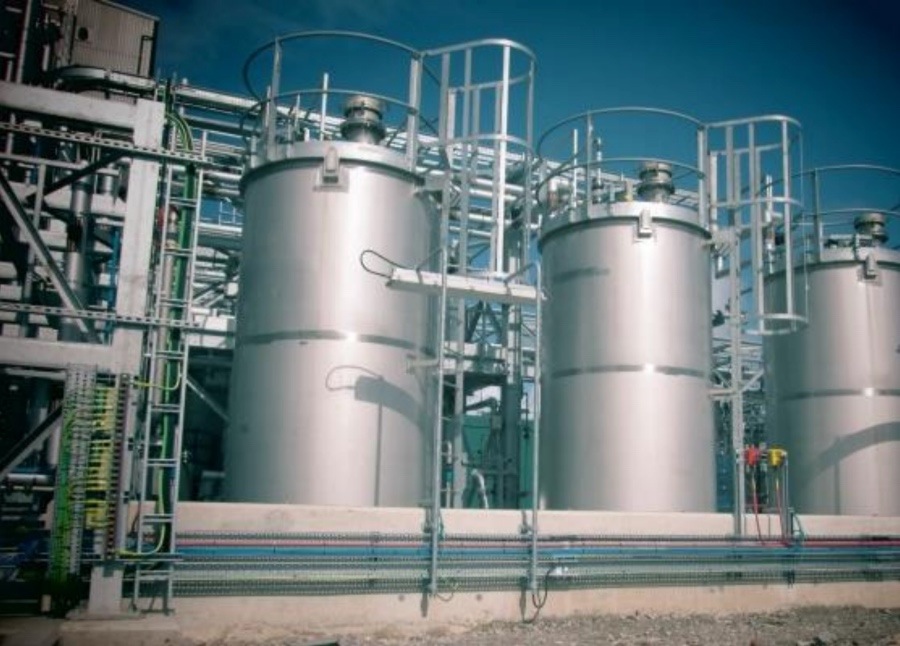
Victrex is the world’s largest manufacturer of polyetheretherketone, a high-performance polymer known as PEEK.
Last year Victrex produced 4,407 tonnes of PEEK and the material is used by other manufacturers to create components for industries such as aerospace, motor, energy, health and electronics.
The polymer is supplied in pellets or as a powder, and is marketed as a more efficient alternative to metal.
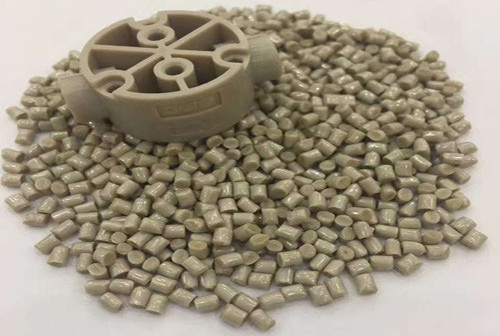
Important PEEK benefits for customers include greater design flexibility and easier manufacturing through injection moulding.
The thermoplastic also offers the equivalent strength of metal despite being 70% lighter than steel, 55% lighter than titanium and 40% lighter than aluminium.
Other attractions include an inherent resistance to friction, fire, chemicals and electricity.

Victrex cites aerospace as a particular sector that benefits from PEEK’s low weight and high durability. The company claims a long-haul plane can reduce fuel costs by $10,000 a year by shedding just 45kg of component mass.
PEEK itself was developed by John Rose and Philip Staniland while they worked at ICI during the 1970s. The first batch was produced in 1978, early sales started in 1981 and production within a dedicated facility began in 1987. 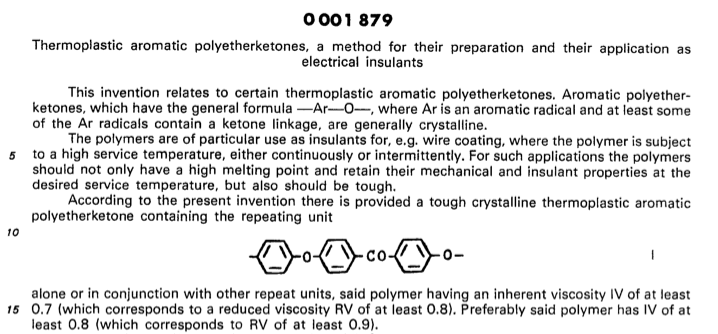
(Source: Google)
Although the original PEEK patent expired years ago, Victrex has continued to develop — and patent — all sorts of new manufacturing processes and higher-quality PEEK varieties and compounds.
The ongoing innovation has apparently garnered a 60% market share of PEEK worldwide and — judging by the aforementioned margin and ROE stats — has also created a sizeable competitive advantage.
Management acquired ICI’s PEEK operation during 1993 and the business was floated as Victrex at 170p during 1995. Back then sales were £31m and operating profit was £10m.
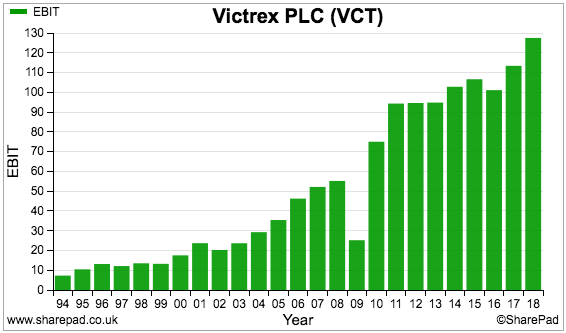
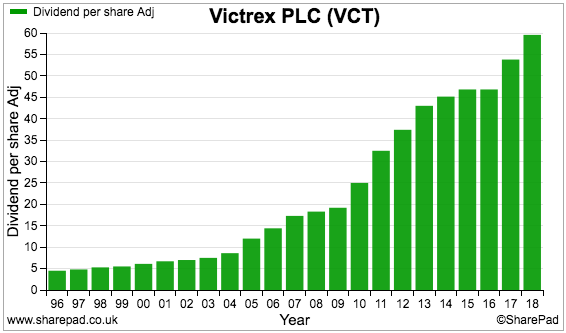
Revenue, profit and the ordinary dividend have each marched higher over time:
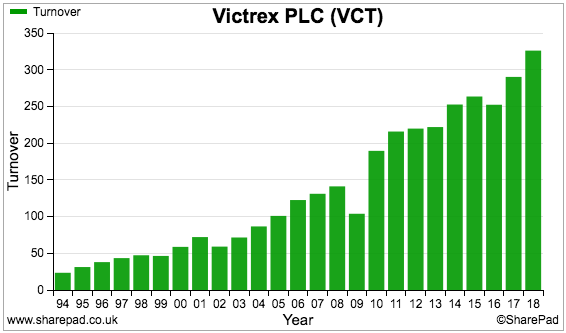
My own spreadsheet shows tonnes of PEEK sold (blue bars) more than tripling since 2000:
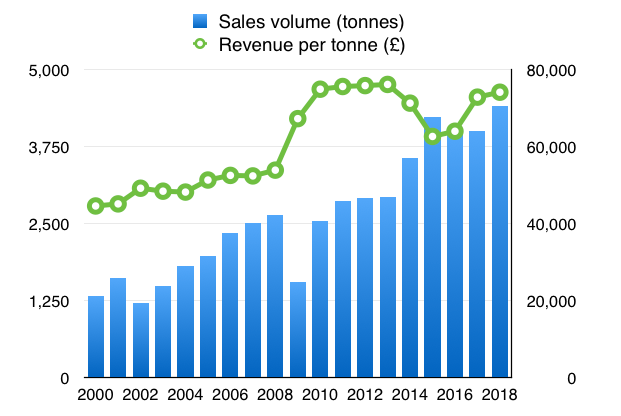
I note revenue per tonne surged after the banking crash and remains above £70,000.
Sales are made throughout Europe, Asia and North America, with the UK representing only 2% of the top line.
Victrex’s SharePad Summary
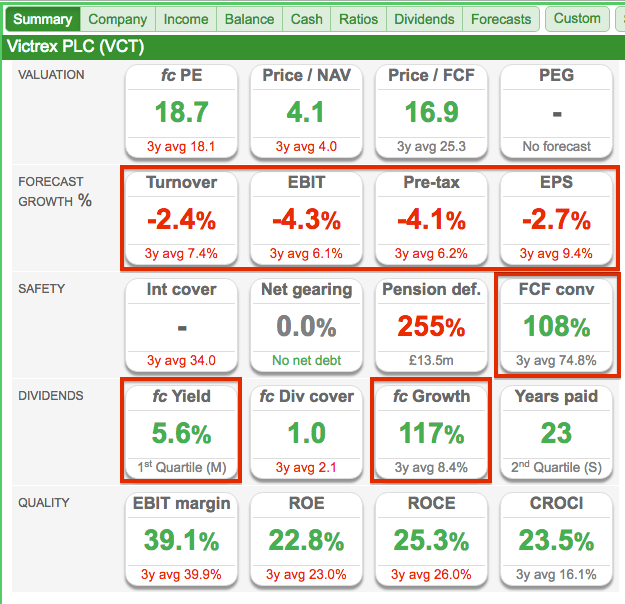 Victrex’s SharePad Summary is shown below:
Some observations:
1) Revenue and profit are expected to decline during 2019 (second row);
2) Earnings are converted entirely into free cash (third row), and;
3) The dividend is expected to surge 117% during 2019 and support a 5.6% yield (fourth row).
Let’s take a closer look at those numbers, starting with the conversion of earnings into free cash.
Cash flow and capital expenditure
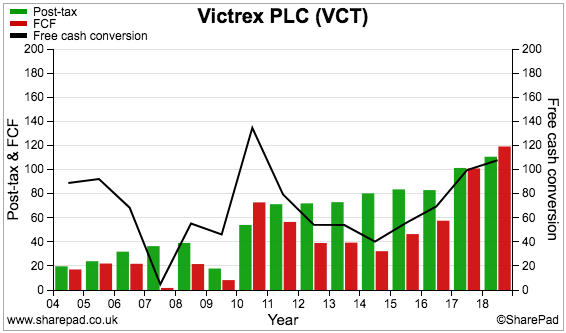
Victrex’s Summary shows a super 108% conversion of earnings into free cash.
(Most companies fail to convert 100% of their earnings into free cash, let alone more than 100%.)
However, 2018 was a favourable year for Victrex’s cash generation.
The black line (right axis) on the chart below shows past earnings converting at rates much lower than 108%:
My Renishaw write-up explained how cash conversion is often held back by:
1) Significant cash being absorbed into additional working capital, and;
2) Expenditure on tangible and intangible assets substantially exceeding the associated depreciation and amortisation charged against profits.
The following chart compares Victrex’s earnings to additional working-capital cash and ‘excess’ capital expenditure:
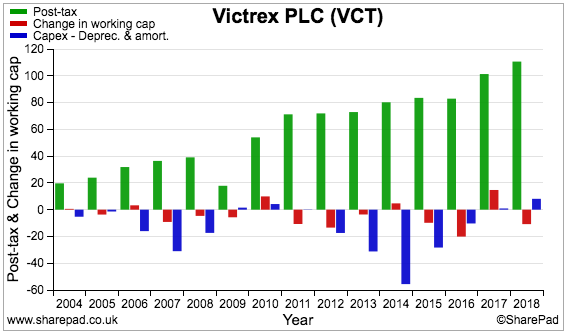
Certainly the ‘excess’ capital expenditure (blue bars) has at times used substantial amounts of free cash.
This next chart shows the difference between depreciation/amortisation (green bars) and capital expenditure (red bars):
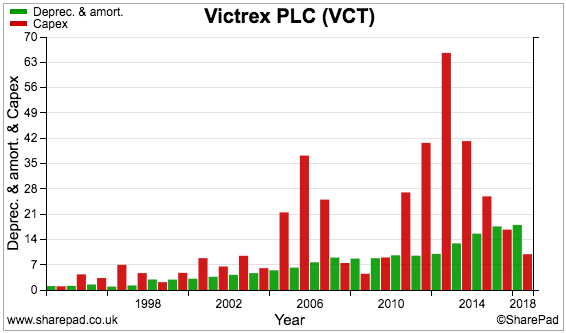
Victrex clearly goes through phases of significant capital expenditure. Old annual reports indicate the money is spent on building new production facilities to cater for greater sales volumes:
The chart below shows how tangible assets — which are mostly plant and equipment — have consistently been the largest component of Victrex’s balance sheet:
And this chart compares the group’s revenue to tangible assets:
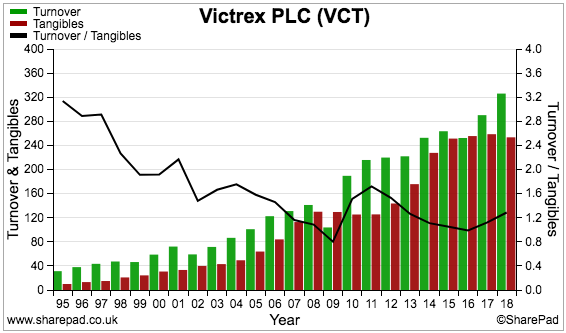
Twenty years ago, sales used to be three times as great as the tangible assets employed within the business. These days the ratio is approximately 1.2 times (black line, right axis).
The downwards revenue-to-tangible-asset trend appears to be responsible for the declining ROE shown earlier.
Simply put, the new production facilities do not seem to generate the same level of return as the older facilities .
Capital expenditure during 2018 was £10m, and the 2018 annual report confirms forthcoming increases: “Our guidance for Group capital expenditure for the medium term at £20m–£25m per annum remains unchanged.
Special dividends underline the ROE theory
Despite all the capex, cash has piled up and debts have been paid off:
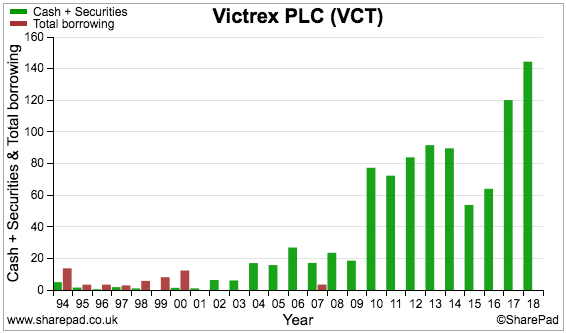
Cash in the bank now totals £144m, or 167p per share.
The group has spent its free cash mostly on dividends (purple bars), with nothing spent on buybacks and little on acquisitions:
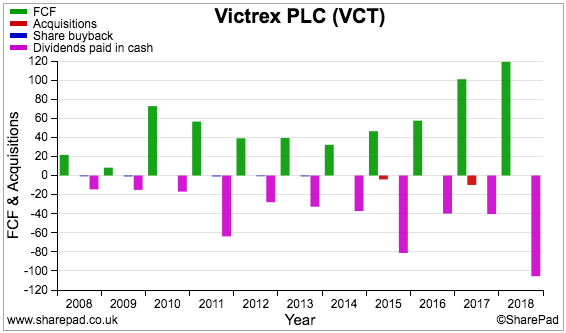
You may be wondering why the dividends (purple bars) in the chart above appear somewhat haphazard and do not reflect the smooth payout progress shown in the earlier chart.
The answer is the payment of special dividends:
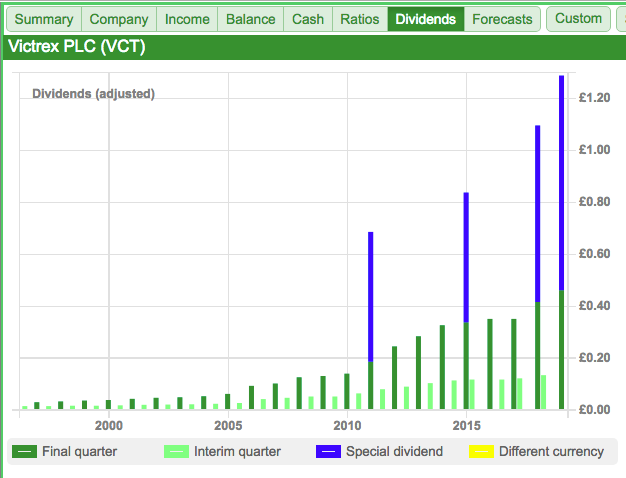
Since 2010, extra payouts totalling 250p per share have been distributed alongside ordinary dividends totalling 390p per share.
Special dividends often bode well for investors. Such payouts underline the company’s ‘surplus’ cash generation and suggest the directors are not harbouring any extravagant/madcap expansion plans.
The special dividends also support the aforementioned ROE theory, whereby high ROE business can frequently generate attractive profit growth and have lots of spare cash to distribute to shareholders.
The ordinary dividend may provide a 2.7% income
A further special payout may explain the predicted 117% dividend advance highlighted on the Summary page.
SharePad shows these forecasts:
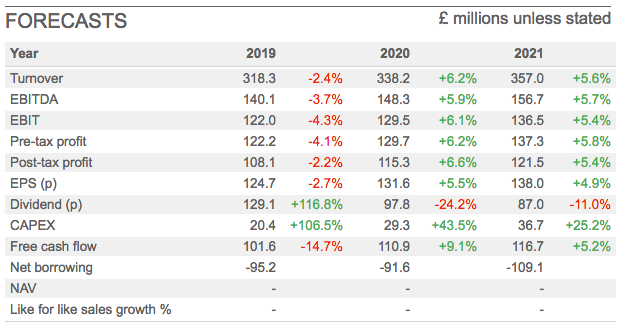
The 117% dividend leap certainly looks odd given revenue and profit are expected to decline between 2% and 4%.
The ordinary 2018 dividend was lifted 11% to 60p per share, and Victrex’s dividend policy is to “grow the regular dividend broadly in line with earnings, whilst maintaining cover around 2x”.
Predicted earnings for 2019 are 124.7p per share, which suggests the ordinary dividend may advance from 60p to 62p per share to maintain dividend cover at “around 2x”.
Subtract that 62p per share from the 129p per share forecast dividend suggests a potential 67p per special payout is included in the projection.
This 67p per share possible special dividend is lower than the 83p per share special payout announced for 2018, and a penny shy of the 68p special dividend declared for 2017.
My 62p per share ordinary dividend guess for 2019 supports a 2.7% income.
Working capital, pension, employees and share count
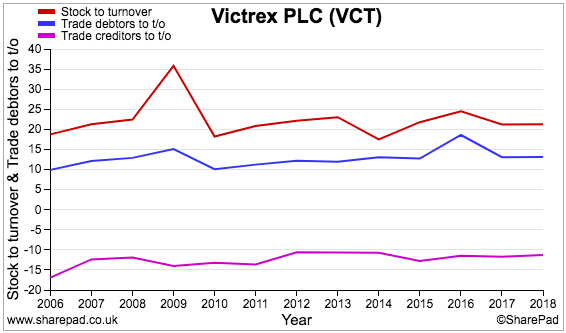
The following charts do not present any worries.
Comparing Victrex’s stock, trade debtors and trade creditors to revenue reveals fairly steady working-capital demands:
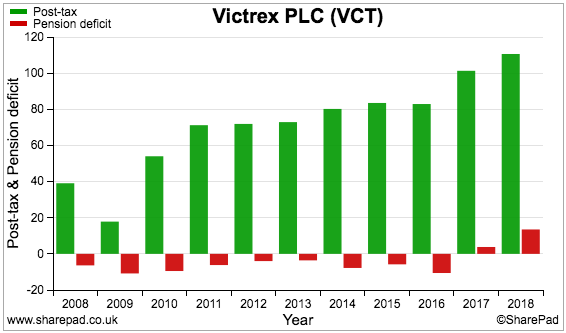
The company’s final-salary pension scheme shows a surplus following many years of exhibiting a relatively small deficit:
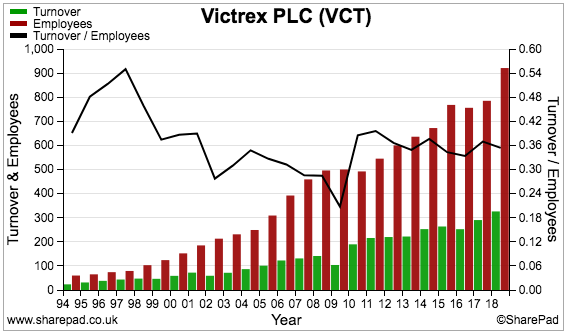
Sales per employee have stabilised around £360,000 — an impressive level that tells me PEEK is a high-value product that may not need an army of persuasive (and costly) salesmen to attract customers:
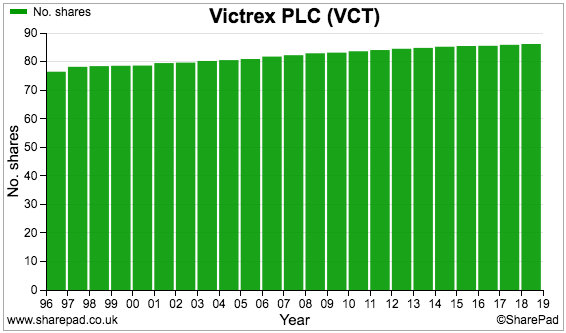
The share count has increased by less than 1% a year since the flotation:
Management’s plan to move “downstream”
One possible drawback to Victrex is management.
David Hummel — who led the 1993 buy-out and subsequently oversaw the company’s impressive financial history — retired from the role of chief executive during 2017.
Jakob Sigurdsson then took the top job and I suppose in time may run Victrex somewhat differently to Mr Hummel.
For now at least, Mr Sigurdsson appears to be following the plans proposed by Mr Hummel — which include moving Victrex “downstream” to manufacture certain PEEK-based components itself.
Example in-house parts include basic pipes, replacement knees and gear cogs:
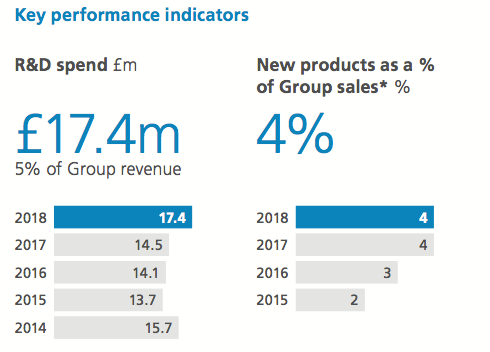
Progress has been slow as Victrex tries to deliver the “burden of proof” to exacting customers. New products represent just 4% of revenue:
Victrex’s board is a typical professional set-up, with the lead executives owning relatively few shares…
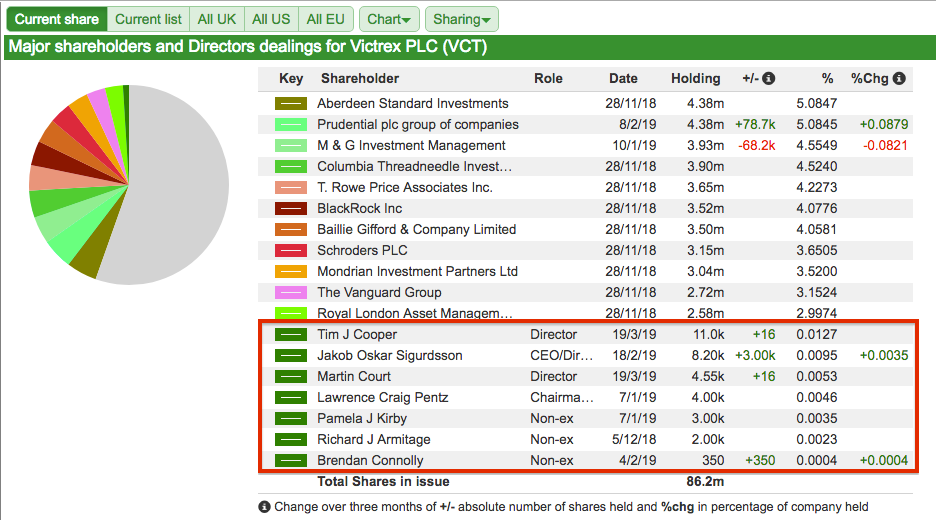
… but taking home around £1 million each during 2018 through a mix of salaries, pension contributions, bonuses and LTIPs.
The time to buy could be 16x earnings
Victrex’s February statement cited “the slowdown in Automotive, the associated impact on Value Added Resellers… some de-stocking [and] expected headwinds in Consumer Electronics” for first-quarter PEEK volumes sliding 22%.
Volumes have occasionally reduced from year to year, most notably during 2009.
Results back then blamed “customers reducing inventories due to the uncertain global economic outlook” for PEEK volumes diving 40% and sharp cuts to revenue and earnings.

While Victrex is sensitive to the health of the global economy, the group could be more resilient than most multinationals.
You may have noticed from the earlier charts that neither the dividend nor the number of employees were cut during the 2008 financial crash.
I dare say Victrex’s subsequent strong rebound following 2008/9 indicates customers should eventually resume orders for PEEK following the latest buying hiatus.
Victrex’s distinguished track record is reflected by a share price (black line, right axis) that has generally traded between 16x and 24x earnings (green line, left axis):
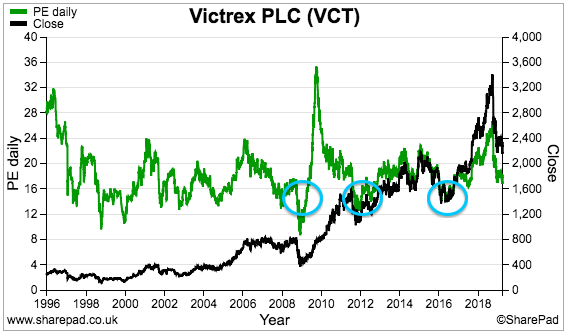
Judging by 2009, 2012 and 2016, the time to buy seems to be when the rating drops below 16x (blue circles).
If you feel Victrex is indeed a ‘quality’ company, you may wish to note a 16x multiple equates to a £20 share price based on the latest EPS forecast.
Until next time, I wish you happy and profitable investing with SharePad.
Maynard Paton
Disclosure: Maynard does not own shares in Victrex.