15 June 2018
By Maynard Paton
Update on Castings (CGS).
Event: Final results for the twelve months to 31 March 2018 published 13 June 2018
Summary: These results came in below the engineer’s earlier expectations — but the performance did not appear too bad in the circumstances. Although CGS’s smaller machining division continues to lose money, its problems now look to be contained. Meanwhile, the larger foundry operation seems to be progressing well following a decent second half. A hefty cash position and the illustrious dividend remain key attractions, but the P/E of 13 does not suggest an immediate bargain. I continue to hold.
Price: 420p
Shares in issue: 43,632,068
Market capitalisation: £183m
Click here to read all my CGS posts.
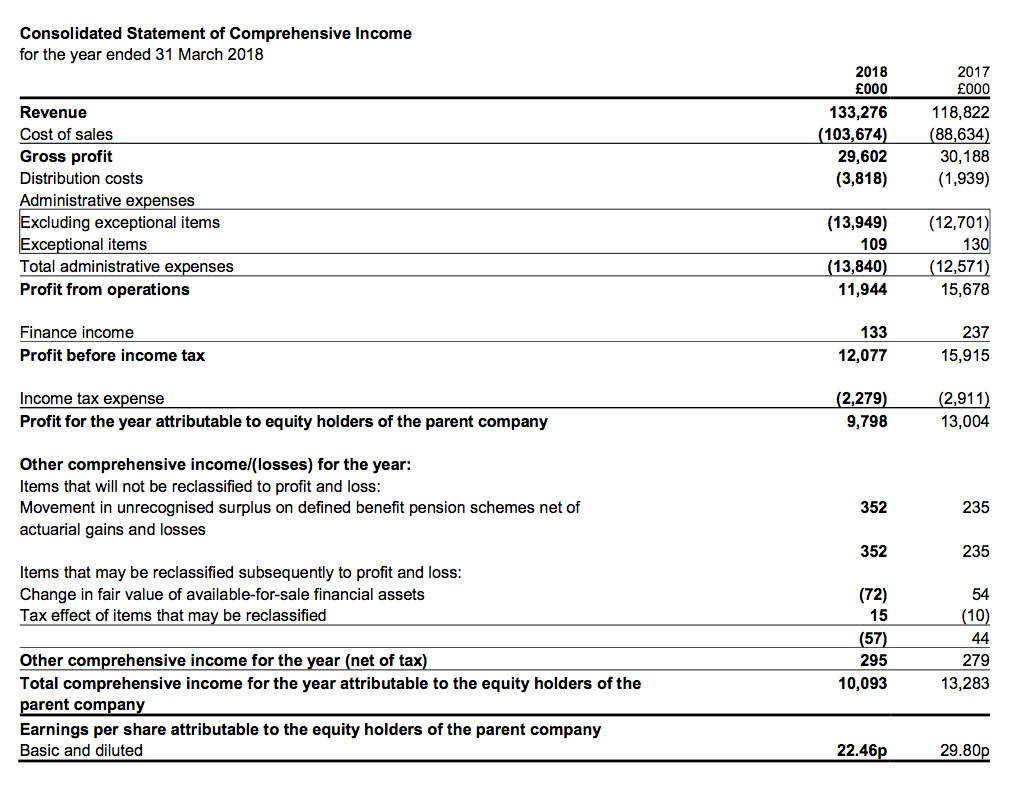
Results:
My thoughts:
* The 25-year dividend record now shows 23 increases, two holds and no cuts
A trading statement during January had indicated these results would show an approximate £13m group profit after one-off costs of £3.4m.
In the event, profit came in at £12m — so, £1m short of the firm’s earlier guidance. At least the one-off costs were actually a fraction lower at £3.3m.
Nonetheless, CGS’s 2018 figures were not too bad. Total revenue climbed 12% while group profit — before the one-off restructuring costs — dropped 3%.
The performance was underpinned entirely by group’s main foundry division, which reported revenue up 14% and profit up 11%. Greater sales of “more complex, machined parts” alongside higher metal prices and favourable currency rates supported the progress.
The full 2018 figures showed revenue just £4m short of the £137m peak set during 2014, and profit at its lowest since 2010:
| Year to 31 March | 2014 | 2015 | 2016 | 2017 | 2018 |
| Revenue (£k) | 137,466 | 131,268 | 132,448 | 118,822 | 133,276 |
| Operating profit (£k) | 21,286 | 17,386 | 19,175 | 15,548 | 11,835 |
| Other items (£k) | 363 | 24 | 315 | 130 | 109 |
| Finance income (£k) | 184 | 137 | 186 | 237 | 133 |
| Pre-tax profit (£k) | 21,833 | 17,547 | 19,676 | 15,915 | 12,077 |
| Earnings per share (p) | 39.6 | 31.8 | 37.1 | 29.8 | 22.5 |
| Dividend per share (p) | 13.0 | 13.3 | 13.7 | 14.0 | 14.5 |
| Special dividend per share (p) | - | - | 30.0 | - | - |
(I note that CGS did not window-dress its 2018 accounts by separating the £3.3m one-off charge within the income statement.)
The dividend was lifted 4% to a new high, and the payout record of the last 25 years now shows 23 increases, two holds and no cuts.
* Revenue and profit per tonne of castings now stand at record levels
CGS’s half-year split emphasised the differing divisional performances.
The foundry operation actually racked up its best H2 profit since 2012, while the troubled machining subsidiary recorded its lowest H2 sales since 2010:
| Foundry | H1 2017 | H2 2017 | FY 2017 | H1 2018 | H2 2018 | FY 2018 | |
| Revenue (£k) | 54,187 | 57,651 | 111,838 | 58,454 | 68,553 | 127,007 | |
| Operating profit (£k) | 6,212 | 8,294 | 14,506 | 6,867 | 9,184 | 16,051 |
| Machining | H1 2017 | H2 2017 | FY 2017 | H1 2018 | H2 2018 | FY 2018 | |
| Revenue (£k) | 3,676 | 3,308 | 6,984 | 3,274 | 2,995 | 6,269 | |
| Operating profit (£k) | 798 | 721 | 1,519 | (999) | (2,951) | (3,950) |
A particular highlight within the foundry division was a further improvement to the revenue and profit earned per tonne of castings produced:
| Year to 31 March | 2012 | 2013 | 2014 | 2015 | 2016 | 2017 | 2018 |
| Foundry revenue (£k) | 117,036 | 106,674 | 119,893 | 113,300 | 114,738 | 111,838 | 127,007 |
| Foundry profit (£k) | 17,761 | 14,656 | 16,225 | 13,064 | 14,682 | 14,506 | 16,051 |
| Dispatched weight of castings (tonnes) | 57,200 | 52,700 | 57,600 | 52,700 | 52,000 | 47,200 | 49,200 |
| Revenue per tonne of castings (£) | 2,046 | 2,024 | 2,081 | 2,150 | 2,207 | 2,369 | 2,581 |
| Profit per tonne of castings (£) | 311 | 278 | 282 | 248 | 282 | 307 | 326 |
Both revenue and profit per tonne now stand at record levels. Once again management referred to “robotic handling” for the “rise in productivity”.
November’s interim statement had already warned of trouble within the smaller machining division.
However, the latest management narrative did suggest the problems had been contained. New subsidiary directors have been appointed, cost overruns have been curtailed and a trading improvement is expected during the forthcoming second half.
* Ratios, balance sheet and pension funding
I must confess that CGS does not score top marks for some financial ratios:
| Year to 31 March | 2014 | 2015 | 2016 | 2017 | 2018 |
| Operating margin (%) | 15.5 | 13.2 | 14.5 | 13.1 | 8.9 |
| Return on average equity* (%) | 21.4 | 16.1 | 18.1 | 13.9 | 9.8 |
(*adjusted for net cash)
When I bought my CGS shares nearly three years ago, I referred to typical margins of 15% and typical cash-adjusted returns on equity of 17%. So the business has not performed as well of late.
My rough sums for the steady foundry division show a 13% operating margin and a return on equity of between 12% and 16% (depending on how much cash resides in the subsidiary). Again, the numbers are not too spectacular in comparison to other shares in my portfolio.
At least CGS’s accounts continue to exhibit plenty of cash — the year-end cash position was £24.1m or 55p per share, with debt at zero.
Cash conversion was adequate. Operating cash flow of approximately £20m funded working-capital movements of £3m, capital expenditure of £11m, tax of £3m and dividends of £6m:
| Year to 31 March | 2014 | 2015 | 2016 | 2017 | 2018 |
| Operating profit (£k) | 21,286 | 17,386 | 19,175 | 15,548 | 11,835 |
| Depreciation (£k) | 6,046 | 6,760 | 6,853 | 7,276 | 8,525 |
| Net capital expenditure (£k) | (9,659) | (8,138) | (7,167) | (14,191) | (11,220) |
| Working-capital movement (£k) | (16) | (4,095) | 1,216 | (1,634) | (3,413) |
| Net cash (£k) | 27,780 | 30,021 | 40,385 | 27,228 | 24,074 |
Meanwhile, CGS’s defined-benefit pension scheme remains in surplus — up £5.8m to £22.6m — and, perhaps uniquely for a quoted company, continues to refund surplus cash back to the group.
CGS explained why it was still contributing to the scheme when the scheme was repaying funds (my bold):
“Repayments of £3.1 million (2017 – £3.8 million) were received from the final salary pension schemes during the year and advances were made to the schemes of £3.3 million (2017 – £2.0 million). The higher level of advances reflects the payments in respect of new pensioners and deferred members transferring out of the schemes.”
I guess that just emphasises the general ‘black-hole’ characteristics of defined-benefit pension schemes. Even when they show a healthy surplus and the trustees have agreed to hand some money back… the scheme still requires significant advances.
Valuation
CGS’s outlook remarks did not seem too concerning:
“It appears at the present time our order book is sound and schedules are increasing. In particular demand for commercial vehicles is currently strong and it is hoped this trend will continue.”,
I would therefore like to think 2019 earnings may at least be quite similar to those of 2018.
Taking the reported 2018 operating profit of £11.8m, adding back one-off costs of £3.3m and deducting 19% standard UK tax, I arrive at earnings of £12.2m or 28.1p per share.
Then subtracting the aforementioned 55p per share net cash position from the 420p share price, my estimate of CGS’s enterprise value (EV) comes to 365p per share or £159m.
Dividing that 365p per share EV by my 28.1p per share earnings guess gives a multiple of 13. That rating does not look an obvious bargain given earnings growth has stalled during the last few years and the machining division has yet to indicate any recovery.
Meanwhile, the ordinary 14.5p per share annual dividend currently supports a 3.5% income.
Maynard Paton
PS: You can now receive my Blog posts through an occasional e-mail newsletter. Click here for details.
Disclosure: Maynard owns shares in Castings.

Thanks for posting, excellent article as usual. Not long but in some ways my kind of business. Solid and unexciting at least on the outside. One for the watchlist for me.
Castings (CGS)
Publication of 2018 annual report
This report contained no additional management commentary and the risks section was unchanged from last year. Here are the other points of interest.
1) Board meetings
I do not highlight this type of information often:
But I do keep watch all the same. Non-exec GB Wainwright has now missed one audit meeting during six of the last seven years. He has been a non-exec since May 1998. True, CGS’s record during that time has suggested the group has decent financial controls. But all the same, non-execs really ought to be attending meetings and not risk complacency setting in.
Astonishingly, CGS’s directors continue their record of failing to report a full attendance for every regular board meeting (the record stretches back to 2007, when the meeting information was first disclosed)
2) Director pay
No major concerns here.
The company remains LTIP-free, pay rises for the lead executives seem genuine although the pay-off to a former director was a hefty £333k (it seems he was paid to resign).
I thought I would include this note as a reminder (to myself) about CGS’s bonus scheme:
£263k for the chief exec to run a business producing a £15m operating profit (before one-off costs) does not appear extravagant:
3) Employees
I am quite impressed with CGS’s employee ratios. The move towards ‘robotic handling’ and other automation processes ought to keep a lid on workforce numbers and their associated cost. The headcount has bobbed around the 1,100 mark for five years now.
For 2018, average revenue per employee reached £121k — second only to the £125k attained during 2014. On the flip-side, the average employee cost CGS £39k, up c£3k from 2017 and the firm’s highest ever.
At least total employee costs as a proportion of revenue was 32.2%, and in line with the 33.9% and 32.4% recorded during 2017 and 2016 respectively.
4) New accounting rules
CGS does not expect any problems with IFRSs 9, 15 and 16:
5) Major customers
CGS’s top 3 customers now represent 53.3% of group revenue — a new high. This ratio has been moving higher for some time — it was 25% in 2010, 34% in 2011, between 45% and 48% during 2012-2016, and 51% for 2017:
The increase has resulted from CGS’s largest customer spending more. Since 2012, revenue from major client 1 has advanced from £28m to £40m. Meanwhile, revenue from major clients 2 and 3 have dropped £1m to £17m and gained £1m to £13m respectively.
Customer concentration is a risk with CGS, but it is encouraging the largest client seems keen to use CGS’s services.
6) Pension scheme
Quite a lot to go through here.
The scheme’s asset summary is shown below:
About £20m has been shifted from equities to bonds, which as the footnote says was “part of a liability-driven investment strategy“. With pension schemes, there is no point being in shares if you can match future liabilities exactly with gilts.
The note also shows pension-scheme assets of £5.6m is repayable to CGS.
This next note shows benefits paid from the scheme rising to almost £3m:
The increase is significant, and it is not clear to me whether benefits paid have suffered a permanent step-change.
For context, benefits paid were £2.6m for 2010, c£1.6m for 2011-2014, £2.0m for 2015, £2.4m for 2016 and £1.8m for 2017. I assume the ups and downs relate to deferred members transferring their benefits out of the scheme, rather than active members receiving haphazard pensions.
Anyway, using the approach I outlined in this post, benefits of £3.0m (plus contributions of zero) from assets of £77.6m gives a ‘required return’ of 3.8%, which is a tad high compared to the 2.6% benchmark.
CGS’s cash flow statement is worth noting:
The group receives payments from the scheme, but at the same time makes advances to the scheme, too. These ‘counter’ transactions have occurred for three years now, and total £8m in both directions.
This next footnote sheds some light as to what is going on. It appears CGS pays the pensions direct, and then reclaims the money from the scheme:
So the scheme’s repayments to the company are not because of ‘surplus’ assets.
But if CGS is paying the pensions direct, what do the aforementioned benefits paid represent? Well, for accounting purposes I think the benefits paid (and admin costs) must represent the payment advances made by CGS.
Within the cash flow statement, £3,321k was advanced to the scheme during 2017. Within the pension scheme, £352k was spent on admin and £2,968k was spent paying benefits to members — so £3,320k in total. That is close enough to the £3,321k for me to understand what is going on. (The figures for 2016 work out almost the same, too)
7) Trade receivables
I like to double-check on trade receivables, just in case CGS’s large customers are playing games with late payments:
Nothing overly concerning here. Year-end trade receivables represent 21.4% of revenue, which compares to 18%-21% for between 2012 and 2017, and 22%-plus for 2010 and 2011. Trade receivables that are past due and not impaired have more than doubled, but the numbers remain very small.
Maynard
Castings (CGS)
AGM trading update
This update was published on 14 August and reassuringly claimed demand remaind “strong” from the group’s main customers. Here is the full text:
—————————————————————————————————————-
Demand from our main customers’ remains strong which represents a continuation of the outlook reported in the Chairman’s statement in June.
The new management team continue to progress the turnaround project at CNC Speedwell. Whilst we still expect the trading results of the machining business to improve during the second half, the level of reorganisation is such that we do not foresee it returning to profitability during this financial year. As part of the reorganisation, we are closing the Fradley site and consolidating the machining business to operate from the newly built facility at Brownhills.
Our investment remains focused on production techniques and technologies to improve our productivity and profitability.
—————————————————————————————————————-
Maynard
Castings (CGS)
AGM attendance
A friendly source attended the AGM and some bullet-points have come my way:
* Board said Castings not trying to grow outside heavy trucks, and will probably remain reliant on Scania, Volvo and Daf. German heavy-truck firms stick to the big German foundries.
* Why investing so much in machining when it had delivered such poor returns? Board said foundry customers increasingly demanded finished components and the trend is towards complete assemblies. Board claimed truck companies may outsource manufacturing entirely.
* Where is growth going to come from? Board said it was picking up new business, e.g. brake parts.
* Brexit? Board was confident customers would stick with CGS because of the cost of switching suppliers i.e. testing and accrediting parts. Customers are used to dealing with suppliers outside the EU – apart from the Germans, CGS’s main foundry rival is in Turkey.
* Apparently, CGS has a niche in more complex, higher-margin, relatively low-volume parts whereas other foundries produce higher volumes of lower-margin parts.
* Board reckons electric heavy trucks are a distant prospect due to the weight of the battery needed for power.
Maynard