02 March 2018
By Maynard Paton
Update on Getech (GTC).
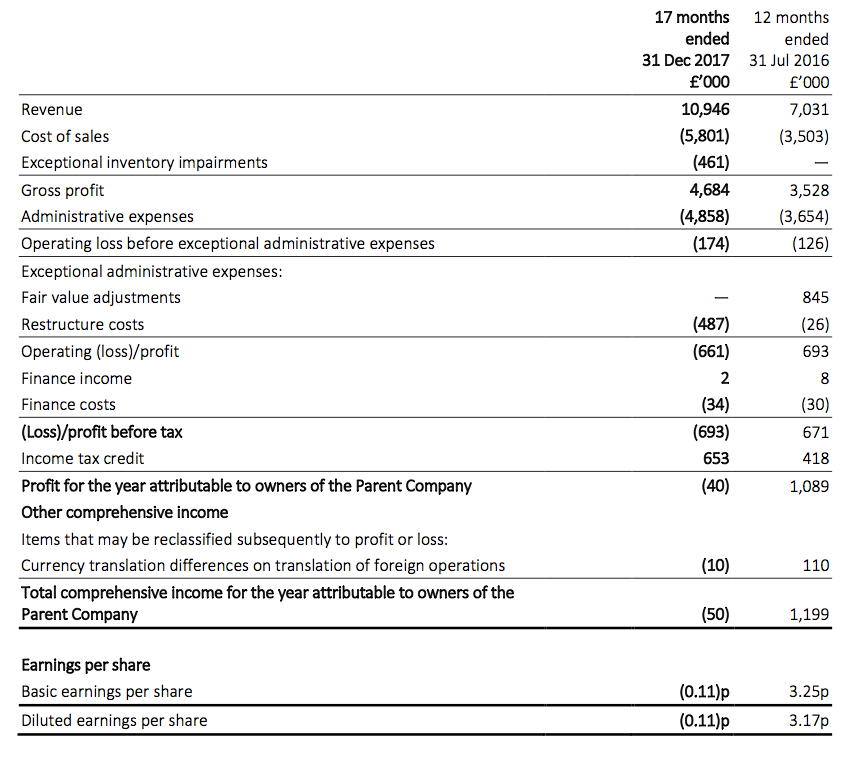
Event: Final results for the seventeen months to 31 December 2017 published 28 February 2018.
Summary: A change of year end, various exceptional items, the effect of an acquisition and the company’s own ‘cost base’ definition meant studying these numbers was not straightforward. However, it was clear the geoscience software specialist has returned to profit, while it was also obvious the new boss remains confident about the group’s competitive attractions. Looking ahead, I am still hoping some encouraging revenue talk alongside tight cost controls could one day lead to much higher earnings and decent share-price upside. I continue to hold.
Price: 30p
Shares in issue: 37,563,615
Market capitalisation: £11.3m
Click here to read all my GTC posts
Results:
My thoughts:
* I calculate a £229k profit run-rate
This peculiar 17-month reporting period was always going to involve a fair bit of number crunching.
Thankfully October’s twelve-month figures and February’s trading update meant many of the important numbers would come as no surprise.
In the event, revenue for the 17 months was £10,946k, which looked impressive against the comparable 12-month figure of £7,031k.
However, the top-line comparison was flattered by the 2016 purchase of Exprodat, which brought in extra sales of £2m. Adjust for the acquisition and I calculate like-for-like revenue dropped 15%.
Importantly, GTC returned to profit following the 2016 loss. My earlier sums had projected a £300k annual profit run-rate, although I’m now guessing the figure is in the region of £229k.
This table compares GTC’s 2016 to the various 2017 numbers:
12 months to 31 July 2016 12 months to 31 July 2017 5 months to 31 December 2017 17 months to 31 December 2017
Revenue (£k) 7,031 7,670 3,276 10,946
Operating profit (£k) (126) 321 (34) 287
Finance costs (£k) (22) (24) (8) (32)
Other items (£k) 819 (451) (497) (948)
Pre-tax profit (£k) 671 (154) (539) (693)
Cost base (£k) (8,048) (7,472) (3,113) (10,585)
Revenue less cost base (£k) (1,017) 198 163 361
The cost-base entries have been derived from this very helpful GTC analysis:
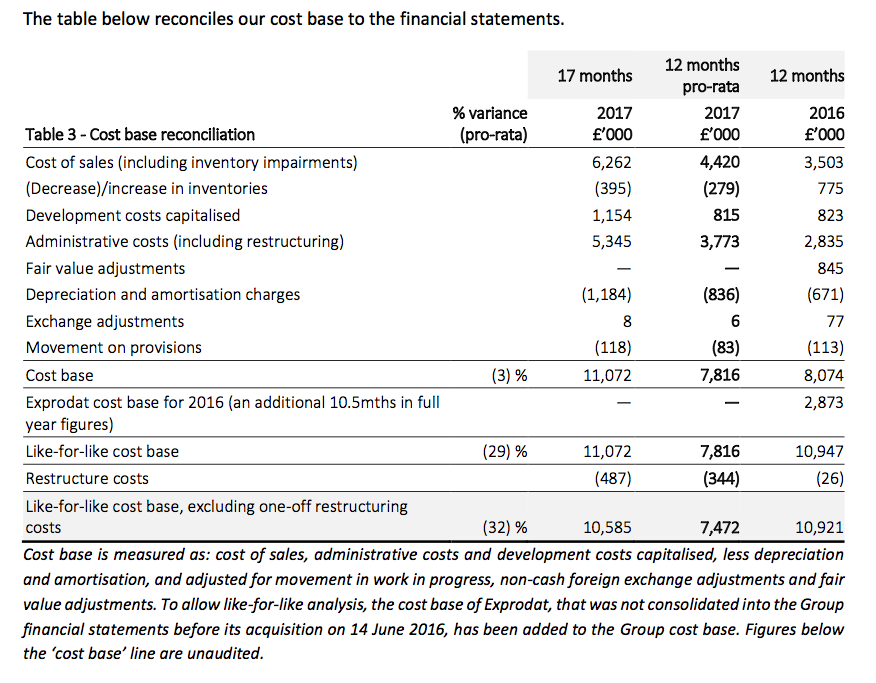
On a 17-month basis, operating profit was £287k while revenue less the cost base was £361k (the difference being due to how various cash movements are reflected as accounting charges). Taking the average of the two and pro-rata to twelve months gives £229k.
What is clear from all of the 2017 numbers is that GTC remains some way off its 2013 profit heyday:
| Year to 31 July | 2013 | 2014 | 2015 | 2016 | 2017* |
| Revenue (£k) | 8,011 | 6,593 | 8,638 | 7,031 | 7,670 |
| Operating profit (£k) | 2,221 | 969 | 1,987 | (126) | 287 |
| Finance costs (£k) | 25 | 32 | 5 | (22) | (32) |
| Other items (£k) | - | - | - | 819 | (948) |
| Pre-tax profit (£k) | 2,246 | 1,001 | 1,992 | 671 | (693) |
| Earnings per share (p) | 5.57 | 5.21 | 5.77 | 3.25 | (0.11) |
| Dividend per share (p) | 2.00 | 2.20 | 2.20 | - | - |
(*17 months to 31 December)
* “We target high-margin, repeat revenue growth”
GTC’s chairman described the 17 months as having witnessed “a wide-ranging programme of commercial, operational and cultural change”.
In fact, it has become quite obvious that the group’s chief exec — appointed mid-2016 — has brought with him a more shareholder-focused approach.
Certainly GTC’s statements are now far more informative under the new regime, and the latest narrative once again included a few encouraging snippets (my bold):
“We target high-margin, repeat revenue growth”
“At the heart of our Products division lies our inventory of technical data assets. Central to this are our holdings of Gravity & Magnetic data – the global coverage of which is multiple times larger than our closest peer.”
“These data are an essential and cost-effective component of the integrated campaigns of our natural resources customers — both in oil & gas and mining.”
“With the re-subscription rate exceeding 95% for the second year in a row, our install-base also grew — this driven by new customer wins (our customer list expanding by 23%) and existing customers deploying the software more widely within their organisations.”
The above snippets all cover the Products division, which remains GTC’s largest and most profitable department:

Product revenue apparently advanced 24% pro-rata, which I have to admit was very pleasantly surprising. Such an improvement suggests GTC’s oil-industry customers may now be emerging from their two-year hibernation.
Overall, the results commentary re-emphasised to me that there is still a decent business here — albeit one that is currently obscured by a weak Services division and wider client activity that remains well below its peak.
* Useful titbits about tax credits and a possible freehold disposal
This 17-month update confirmed the trading downturn had left various ratios at mediocre levels:
| Year to 31 July | 2013 | 2014 | 2015 | 2016 | 2017* |
| Operating margin (%) | 27.7 | 14.7 | 23.0 | (1.8) | 2.6 |
| Return on average equity* (%) | 59.1 | 44.7 | 33.3 | 13.0 | (0.4) |
(*17 months to 31 December ** adjusted for net cash)
However, the figures did show a healthy working-capital movement after October’s 12-month statement owned up to a customer being late paying a near-£1m bill:
| Year to 31 July | 2013 | 2014 | 2015 | 2016 | 2017* |
| Operating profit (£k) | 2,221 | 969 | 1,987 | (126) | 287 |
| Depreciation and amortisation (£k) | 214 | 240 | 366 | 671 | 1,184 |
| Net capital expenditure (£k) | (190) | (190) | (1,364) | (856) | (1,208) |
| Working-capital movement (£k) | 942 | (1,574) | 573 | (448) | 554 |
| Net cash (£k) | 4,249 | 3,423 | 3,694 | 1,888 | 1,759 |
(*17 months to 31 December)
(GTC’s year-end change may lead to less dramatic fluctuations to debtor and creditor levels — see my Comment below).
Something else worth noting is the relationship between cash capital expenditure and the aggregate depreciation and amortisation charge.
For this 17-month period, the figures matched closely. But further inspection of the accounting small-print (see my Comment below) shows £1,154k spent on development costs while the relevant amortisation charge came in at £494k. The £660k difference is substantial for GTC’s size, and may one day filter through to the main accounts.
(As the new boss is happy to show all of the intangible expenditure within that cost-base table, I do wonder why such items are not expensed entirely through the income statement as well.)
Although GTC’s main numbers had already been highlighted within earlier statements, this 17-month update did reveal two useful financial titbits.
First, some positive news about tax.
Various credits, refunds and adjustments helped GTC collect £461k from the tax authorities, and further cash tax receipts are expected for 2018. The balance sheet shows current tax receivables at £490k.
Second, a hint about property. GTC’s chairman said:
“We are examining all options regarding our Kitson House office in Leeds.”
I am not surprised by this remark. I asked GTC’s new boss about the freehold in November and he suggested it would be “looked at”.
This RNS says the property was purchased during 2006 for £2.5m, although the 2007 annual report says the cost was £2.8m (the difference probably being the associated purchase expenses). The asset is presently in the books at £2.4m (6.5p per share).
Owning this freehold looks an extravagance to me given the group’s size and recent financial history.
I trust the property can soon be sold to clear the group’s £634k borrowings and bolster the £2,393k cash position. I should add GTC remains free of any pension obligations.
Valuation
This 17-month statement provided some relatively promising comments about current trading and potential cash flow (my bold):
“It remains early in the year, but our sales pipeline has the potential to exceed 2017 levels. This reflects a Q1 upturn in data sales for frontier regions, and continued growth in the user-base for our software and information products.
This strategic formula has already helped us to cross-sell our products and services, enter new sectors, and access rich seams of new data with significant 2018 revenue potential.
Net of our revenue sharing agreement with the Sierra Leone Government, a single licensing of this dataset has the potential to be a disclosable event for the Getech Group.
“We have begun 2018 by backing our growth ambitions with targeted operational, sales and marketing investment. We do not however anticipate significant upward pressure on FY costs.”
“By broadly maintaining this cost and tax structure, a similar pro rata sales performance… would generate a cash inflow of approximately £0.5 million (post-investment and debt repayments).”
“With c85% of our cost base fixed, each 10% increase in revenue would broadly translate to a £0.6 million increase in free cash flow.”
That final remark is informative, as it suggests an extra £1.1m of revenue would produce additional free cash flow at a margin of more than 50%. So it may not take too much extra Product revenue to see a notable operating improvement.
That said, I would not value GTC on its cited cash flow projections because they do include the aforementioned net inflows from the tax authorities. For what it is worth, I am hoping the business can earn a ‘clean’ £200k to £300k operating profit for 2018 — with my fingers crossed for some upside should extra revenue actually arrive.
Factor in my profit guess, the £1.8m net cash position, the £2.4m freehold and a bit of extra tax money, and the current £11m market cap probably looks about right for now.
Nevertheless, I am hopeful the share price will prove to be a bargain for the longer term — assuming additional revenue does arrive one day and translates into much greater earnings.
Maynard Paton
PS: You can now receive my Blog posts through an occasional e-mail newsletter. Click here for details.
Disclosure: Maynard owns shares in Getech.

Getech (GTC)
Publication of 2017 Annual Report
Credit to GTC for publishing its annual report alongside its results RNS. Here are the main points of interest:
1) Risks and uncertainties
I am suprised the Financial Risk has increased:
The talk in the management narrative is of better working-capital management (see below). Maybe the greater risk relates to the chance of an increase to borrowing costs. GTC’s borrowings of £634k are entirely variable-rate loans with a current rate of 2.04% plus base rate.
2) Board meetings
I always look at these board-meeting numbers, just to see if any directors are not pulling their weight:
I see Mr Edwards once again did not attend every meeting. Perhaps then it is no surprise he is stepping down from the board.
(Ah — the small-print within Note 6 of the accounts shows Mr Edwards worked a four-day week).
I am pleased the directors like to talk more about audits and risk than their own pay.
3) Substantial shareholders
I still can’t fathom why GTC lists only shareholders owning 10%-plus:
Every other company seems to use 3%-plus for their reports, which is the level for an RNS holding notification. Maybe GTC’s annual report disclosure is based on one of those an AIM ‘do what you want’ guidelines.
4) IFRS15 revenue recognition
Here is a reassuring snippet about the new revenue/contract accounting practice:
Some software groups may find their reported earnings scuppered by IFRS 15, as the new regulation tightens up the recognition of longer-term contract income.
5) Staff and director pay
Not often you see this type of comment about pay cuts in an annual report:
I see average staff numbers were to cut from 118 to 95 during the year, and now stand at 84:
The average pro-rata staff cost for 2017 was £56k, which compares to £47k for 2016 and is probably distorted by redundancy payments. An encouraging stat is average revenue per head, which for 2017 pro-rata was £81k and compares to £62k for 2016. That said, revenue per head was £114k at its 2013 peak.
The new boss is being paid a fair whack at £250k:
His £250k is double what the previous chief exec collected. However, various executive departures meant the total £825k director wage bill for 2017 is pro-rata equal to £589k spent during 2016.
6) Research and development expenditure
This note shows R&D expensed to the income statement at £916k:
Pro-rata for 12 months and this expensed R&D dropped almost 40% from 2016.
This next note shows how much R&D was capitalised on the balance sheet:
During the 17 months, GTC spent £1,154k entirely on ‘development costs’.
However, amortisation of those development costs was £494k — giving a difference of £660k. A further £455k of amortisation was charged against other intangibles, to give a total amortisation charge of £949k.
So while the total £949k amortisation charge is quite close to what is being capitalised (£1,154k), I don’t think that will always be the case. Some of the other intangibles will, within the next two years, will be written down to zero (or close to zero), and then that £660k difference will start to show up in the main accounts.
At present, a £660k difference between R&D being capitalised and R&D being amortised is a significant bookkeeping decision and makes all the difference between an accounting profit and loss.
7) Trade receivables and deferred income
The change of year end from July to December has had a notable effect on certain working-capital entries.
The finance director’s report says:
“The reduction in the Group’s Trade and Other Receivables over the period reflects the combined benefit of strengthening and streamlining of our revenue collection process, and the Group Accounting Reference Date no longer being co-terminus with the Globe subscription billing cycle.
Overall, Trade and other receivables reduced by £1,250,000 (2016: £1,491,000 reduction). Through improvements to the revenue collection process, we are achieving quicker collection of debtors and, we have recovered £45,000 in debts that were previously provided for, however, we have made an additional provision for debtors amounting to £163,000 during the period.
During AP 2017 Getech reshaped the Globe product to more closely align its evolution with our customers’ day-to-day needs. One step to achieving this was to move from a 3-year product cycle, to an annual product cycle. Reflecting this new commercial formula, Deferred Income balances have reduced and this is a contributing factor to the reduction of Trade and Other Payables by £1,092,000 (FY 2016: £1,165,000 reduction).”
(I can’t recall ever seeing the phrase “being co-terminus” in an annual report before.)
Essentially trade receivables (money owed to GTC by clients) and deferred income (money paid upfront to GTC by clients for services not yet delivered) should now be less significant (and I therefore hope less concerning) given the year-end does not coincide with a major product billing cycle.
This is the trade receivables note:
And here are the associated ‘past due’ amounts
Trade receivables of £1,424k represent 18% of the pro-rata 2017 revenue. Past years have seen that percentage anywhere between 20% and 40%.
Meanwhile, past-due-but-not-impaired trade receivables represent 6% of total trade receivables. I am pleased the figure has returned to within its traditional single-digit range, after 2016’s comparable came in at 15% and looked a tad ominous for a year when revenue decreased.
Turning to deferred income:
Deferred income of £653k represents 9% of 2017 pro-rata revenue. Comparable figures for the previous five years were all 17% or above.
8) Tax
I hardly ever look at these taxation notes. They are often too complicated for me, and any companies with aggressive accounting policies — evidenced perhaps by declaring tax in the income statement but not paying any to the authorities — can be spotted using other financial measures.
That said, it is worth looking at these notes if a company is claiming significant tax refunds. GTC received a fair whack during 2017:
I have no idea how these R&D credits are calculated, but a few hundred £ks a year is worth the HMRC paperwork.
9) Options
The potential dilution from options is 7.6%:
10) Large clients
Prior to 2016, GTC’s revenue was regularly supported by a handful of large clients. Recent acquisitions though have diversified the top line and once again no customer created 10%-plus of revenue:
Around a third of revenue continues to come from the USA.
11) Freehold property
Here is confirmation of the freehold book value:
Maynard
Getech (GTC)
AGM statement
GTC’s AGM statement was published on 10 April. Nothing of significance was revealed.
Essentially the entire statement repeated/re-worded the remarks made within the preceding annual results. At least these snippets about recent trading matched the expectations made within the results:
“Q1 2018 revenues were in line with Q1 2017, but within the mix we have seen an increase in sales of data and information products for frontier areas, increased demand for product training and we have a strong list of new customers trialling our software.”
“Our sales pipeline for 2018 is larger and more diverse than in 2017 and we are engaged on a series of exciting and potentially material data, information product and software campaigns. These have the potential to deliver revenue above 2017 levels.”
Here is the full text:
—————————————————————————————————————————–
At today’s Annual General Meeting, Jonathan Copus, the Chief Executive Officer of the Getech Group (AIM; GTC), will give the following statement:
“Getech provides geoscience and geospatial products and services to companies and governments that they use to de-risk exploration programmes and improve their management of natural resources. In the 17-month accounting period to 31 December 2017 (referred to as AP 2017[1]) we integrated the acquisition of Exprodat, rebased costs, strengthened our commercial offering, and repositioned Getech’s operational and financial strategy. This strategy places our data, software and information products at the heart of our business. By doing this we target high-margin, repeat revenue growth and we are reshaping our services to more clearly leverage our products and geoscience-geospatial skills.
These steps have significantly strengthened Getech’s finances, they have helped us to cross-sell our products and services, we have entered new sectors, and accessed rich seams of new data with significant 2018 revenue potential. We view the progress made to successfully re-align our business to reflect the collaborative approach that we have established with our customers.
Operations
In AP 2017 we refreshed and expanded our gravity and magnetic data inventory and accessed more seismic and well data. This allows Getech to provide a richer and broader suite of essential data to our customers, focused in regions where we see clear commercial catalysts to drive buying interest. One example is Sierra Leone where in 2017 we assembled a suite of seismic and well data for the Government, which in 2018 we are using to promote the country’s Fourth Offshore Licensing Round.
Our data holdings also underpin Getech’s Information Products. In AP 2017, Globe entered its eighth year of development, we added another supermajor customer, and we completed Globe’s second three-year build-phase on budget and schedule. With the foundation-stone now complete we have moved the commercial model to an annual release cycle, which allows us to deliver a more agile product with content that evolves with the needs of our customers. Lower budgets continue to provide a challenging environment for our Regional Reports, however an uptick in interest offers encouragement.
We enhanced our software products (Data Assistant, Exploration Analyst, Unconventionals Analyst) to include a range of new customer requested functionality and upgraded them to support Esri’s latest releases. With the resubscription rate exceeding 95% for the second year in a row, our install-base also grew, and our software customer list expanding by 23%.
In contrast to our product activities, our service teams continued to face a much tougher trading environment – the division in AP 2017 delivering a gross margin of 7% (FY 2016: 24%). Underlying this figure is a very difficult geoscience services market, where despite headcount reductions a lack of billable work eroded the division’s profitability. Trading in our geospatial services group was much stronger, the team’s skills continuing to win new work and open doors to opportunities within oil and gas and across a range of new sectors. By wrapping our services more tightly around our products and combined geoscience-geospatial skills, and through a focus on cost control and enhanced project management, we target stronger service returns.
Financials
AP 2017 delivered a step-change in the cash profitability of Getech – pre-restructuring costs, the Group generating a net operating cash inflow of £2.1 million (FY 2016: £0.3 million outflow) and a free cash inflow of £0.1 million (FY 2016: £2.0 million outflow). Driving this, product revenues grew 24% pro-rata, delivering a 65% gross margin before impairments. This trajectory was enhanced by the acquisition of Exprodat, and at the Group level was reinforced by a 32% reduction in costs. These positives were partially offset by what remained a challenging market for geoscience services.
Post capital investment, we used the balance of our operating cashflow to settle all remaining M&A cash obligations and to pay down one third of our debt. We also invested in the Group’s sales and project management capabilities – our focus being to grow revenue and de-risk profit.
Inclusive of restructuring costs, Getech ended AP 2017 in a net cash position of £1.8 million (31 July 2016: £1.9 million); cash and cash equivalents totalling £2.4 million (31 July 2016: £2.8 million).
Outlook
Our customers have worked hard to lower their cash flow breakeven and we see no evidence that they will reverse the capital discipline that this has required. However, the downturn in oil prices has also challenged our customers to rethink the way that they access, manage and analyse data. By strengthening Getech’s offering as an essential data, software and information provider, we are positioning the Group for growth in this exciting new operational landscape.
By moving our year-end to 31 December (from 31 July) we have placed our reporting cycle in line with our customers’ budget cycle. This also introduces more seasonality into our financial results – based on history the H1:H2 revenue split moving to a 40:60 ratio (from an average of approximately 50:50).
The January to March Q1 period is at the start of our customers’ annual spending cycle and is a time when we are focused on establishing a strong marketing and sales schedule for the balance of the year. Q1 2018 revenues were in line with Q1 2017, but within the mix we have seen an increase in sales of data and information products for frontier areas, increased demand for product training and we have a strong list of new customers trialling our software. The market for geoscience services remains challenging, however our geospatial, gravity and magnetics service teams have built a healthy programme of billable work. We remain focused on capital discipline and have taken steps to rationalise the Group’s footprint – our Henley and London service operations to combine in Q3 2018.
Our sales pipeline for 2018 is larger and more diverse than in 2017 and we are engaged on a series of exciting and potentially material data, information product and software campaigns. These have the potential to deliver revenue above 2017 levels. By combining this with significantly lower cash costs, that are largely fixed and broadly in balance with AP 2017 revenue, our cash flow has significant leverage to growth – a similar pro rata sales performance to AP 2017 (sales mix and divisional margin) generating a cash inflow of approximately £0.5 million (post-investment and debt repayments) and each 10% increase in revenue broadly translating to a £0.6 million increase in free cash flow.
With the cash that results, we are committed to invest in our operations, reinstate dividend payments and explore acquisitions. We must also ensure that our capital works hard for the benefit of shareholders and we continue to examine all options regarding our Kitson House office in Leeds.”
Stuart Paton, Chairman of Getech Group plc, said:
“The last year has seen continued strong leadership under Jonathan. Under his direction, we have made significant changes to the culture, organisation and strategic positioning of the business which have already started to impact on the bottom line. I am very pleased at the recent appointments of Andrew Darbyshire and Chris Jepps to the Board. This with the establishment of a new Executive Committee greatly strengthens the capability and breadth of our senior leadership team. I would like to take this opportunity to thank all of Getech’s staff for their continued hard work and dedication. I am confident that our strong team, strategy and positioning will lead to the future growth of the business.”
—————————————————————————————————————————–
Maynard
Getech (GTC)
Publication of subsidiary annual reports
ERCL and Exprodat recently published their 2017 annual reports:
ERCL 2017 annual report
Exprodat 2017 annual report
ERCL was acquired by GTC on 7 April 2015. Exprodat was acquired by GTC on 14 June 2016.
By comparing these subsidiary accounts with the main PLC accounts, we may be able to determine how each part of the group is performing.
The 2017 ERCL report shows revenue of £1,920k, a £163k operating loss and a £461k exceptional write-off.
The 2017 Exprodat report shows revenue of £2,768k and a £143k operating profit.
The rest of the GTC group (‘other GTC’) therefore produced revenue of £10,946k less £1,920k less £2,768k = £6,258k and an operating profit of £287k less (£163k) less £143k = £307k.
Revenue per month during the 17 months to December 2017 for ERCL, Exprodat and ‘other GTC’ were £113k, £163k and £368k respectively.
In comparison, revenue per month during the 12 months to July 2016 for ERCL, Exprodat and ‘other GTC’ were £179k, £201k and £379k respectively.
So the changes to revenue per month from 2016 to 2017 were (37%), (19%) and (3%) for ERCL, Exprodat and ‘other GTC’ respectively.
Clearly the acquisitions have not fared as well as the main business. Certainly ERCL looks to have suffered badly since its purchase. During the 12 months to July 2015, this outfit produced revenue of £4,235k — or £360k a month. That figure has since fallen 69%.
Sadly there is not a lot else of consequence to divine from the subsidiary reports. I had hoped one of the subsidiaries had racked up huge losses, which would have suggested ‘other GTC’ had been doing really well and all that was needed for a major profit boost would be to close down the troubled division.
As it happens, all of GTC’s operations appear to be running at close to breakeven. ‘Other GTC’ also saw its revenue slide a little last year, too.
I guess everything now rests on what the different divisions can all do from here.
Maynard
Getech (GTC)
Sierra Leone Fourth Licensing Round
The round had been extended by three months. Today’s update contains one or two interesting snippets (my bold):
————————————————————————————————————————
Following an extended election period, resulting from the run-off between the two main political parties, the Government of Sierra Leone has decided to extend the close date of the country’s Fourth Licensing Round to the 27th September 2018.
This License Round is being exclusively supported by the Getech Group (AIM; GTC), through its wholly owned subsidiary ERCL.
Jonathan Copus, CEO of the Getech Group commented:
“The offshore waters of Sierra Leone contain proven petroleum systems, the understanding of which are supported by an inventory of extremely high quality geological and geophysical data. With much of this data being made available for the first time, the country’s Fourth Licensing Round has generated significant levels of interest from the international oil and gas industry.
Following the Round’s London launch in January, which was attended by more than 30 companies, activity has moved on to a busy programme of technical and commercial review – staff of the Petroleum Directorate and Getech welcoming a broad spectrum of International Oil Majors and large Independents to Data Rooms held in Freetown (Sierra Leone), London (UK) and Houston (USA).
In partnership with the Republic of Sierra Leone, Getech’s goal is to attract international investment via a strong and transparent licensing process, through which the country’s people will gain both near-term and long-term national benefit. With levels of exploration activity beginning to rise across the oil and gas industry we look forward to concluding Sierra Leone’s Fourth Licencing Round.”
————————————————————————————————————————
GTC had said the following within the annual results:
“Net of our revenue sharing agreement with the Sierra Leone Government, a single licensing of this dataset has the potential to be a disclosable event for the Getech Group.”
I am not entirely sure, but I would guess the oil firm that takes on the licence is likely to pay for the GTC dataset that is currently available to view at the three data rooms.
The PDSL website has some informative background information on this licensing round.
Maynard
Getech (GTC)
Trading update
A very long-winded update that essentially revealed a stable-ish financial performance, with the business continuing to operate at around break-even.
Here is the full text:
————————————————————————————————————
The Getech Group (AIM; GTC) provides geoscience and geospatial products and services to companies and governments, which they use to de-risk exploration programmes and improve their management of natural resources. In 2017, through a programme of commercial, operational and cultural change, we refocused Getech’s activities around a suite of data, software and information products; the value of which we enhance through services that leverage our products and geoscience-geospatial skills.
This product-led strategy targets growth in high-margin recurring-revenue opportunities and the evolution of our business is evident in the scale and structure of the sales closed in H1 2018.
Maiden January to June H1 interim results
Having recently moved our Accounting Reference Date to 31 December, this is Getech’s first Trading Update for the 1 January to 30 June period. As previously noted, the new Reference Date introduces seasonality to our financial results, H1:H2 revenue historically being split in a 40:60 ratio. Interim results for the Getech Group will be published on or around the end of September 2018.
Operational summary
In repositioning Getech we have placed the customer at the heart of our business. We do this through customer collaboration, a focus on how we add value, the provision of training and a commitment to product and service enhancement.
In H1 2018 we expanded the content and functionality of Globe to include innovative new heat flow and palaeo-surface geology modules, which draw on our geoscience expertise and graphical analysis tools, which leverage our software skills. Having moved Globe to an annual release-cycle, the first of these was completed on time/on budget in H1 2018 and delivered to customers in July 2018. We upgraded our geospatial software products to include a range of new customer-focused functionality, and we promoted our data offering through licensing rounds and integrated product sales. We are using these products and our geoscience-geospatial skills to reshape and differentiate our services. In H1 2018 our Gravity & Magnetic team worked to full capacity and the Geospatial team won an additional long-term support contract with a super-major. We also diversified our revenues with contracts in the environmental, utilities and maritime sectors. As a part of the roadmap to improving the profitability of our Geoscience Services, in H1 2018 we strengthened our tendering process and took steps to consolidate our Henley and London activities into a single London location.
————————————————————————————————————
Ok, so that is the preamble out of the way. Here is the important bit:
————————————————————————————————————
H1 Revenue and Sales
Having aligned our Information Products with the programme of continuous improvement already established in Software, in H1 2018 we launched a sales campaign to target new customers and multi-year subscriptions for both. Early success in this campaign lifted the total value of sales closed in H1 2018 to £4.3 million, a 39% increase on the total sales closed in H1 2017 (£3.1 million).
Given the multi-year nature of many of these sales, revenue recognition splits them between products and services delivered in H1 2018 and those that will be delivered in future periods. H1 2018 revenues totalled c. £2.9 million (H1 2017: £3.1 million) with the £1.4 million balance (H1 2018 total sales closed, less H1 2018 revenue recognised) being the increase in sales of products and services that will be delivered in future periods. The majority of these forward sales will be delivered in H2 2018 and FY 2019 and at 30 June 2018 we had invoiced for c. 50% of the total forward sales value.
————————————————————————————————————
This performance does not seem all that bad in light of the group’s past struggles.
Sales agreed of £4.3m during H1 2018 were £1.2m greater than H1 2017. Sounds good, but £1.4m of the £4.3m will be recognised as revenue during H2 2018 and beyond. So £2.9m will be recognised as revenue during H1 2018 versus £3.1m during H1 2017.
Although revenue is £0.2m lower, the additional £1.4m of ‘later’ revenue compares to zero for 2017. So I think on balance I would rather take this H1 2018 performance than last year’s comparable effort.
Note, too, that H1/H2 2017 revenues were at least £3.6m, so this RNS is referring only to certain divisional income and not revenue from the entire group (I think).
————————————————————————————————————
In addition, echoing the lumpy sales pattern that we are working to dilute through recurring revenue growth, a $0.9 million data sale negotiated in H1 2018 frustratingly missed the 30 June period-end. This sale is now closed. With it H1 revenue would have risen 16% year-on-year and total H1 sales would have risen 69%.
————————————————————————————————————
Ah, ok, that is a shame. But at least the sale has now been banked.
————————————————————————————————————
Cost base*
Having lowered our cost base by 32% between 2016 and 2017, in H1 2018 we focused on balancing capital discipline with a continued programme of product investment. We also strengthened our sales and project management capabilities. Inclusive of these investments, our cost base totalled £3.5 million (H1 2017: £3.7 million) a c. 4% year-on-year reduction.
————————————————————————————————————
I am not sure about this cost-base claim.
Because of the year-end change (from July to December), strict like-for-like numbers have not been published.
But my review of the 2017 figures (to July) suggested the cost base during H2 (i.e. six months to July 2017) was £3,558k — which compares to the £3.7m reported in this RNS.
Now we are told the cost base during the six months to June 2018 was £3.5m — just a fraction lower (apparently) than last year.
On the other hand, one of the tables in the Blog post above says the cost base was £3,113k for the five months to December 2017, which becomes £3.7m for six months — so £0.2m higher than the H1 2018 cost base.
The only firm conclusion I can make is that the cost base is not going up, which suits me.
————————————————————————————————————
Net Cash and Receivables
Net Cash balances at 30 June 2018 totalled £1.4 million. This was higher than at 30 June 2017 (£0.8 million). Reflecting the seasonal H2-weighting of Getech’s revenue, Net Cash was lower than at 31 December 2017 (£1.8 million). However, with the rate of sales ramping up through H1 2018 and c. 50% of forward sales yet to be invoiced at 30 June 2018, receivables grew to £2.5 million (31 December 2017: £2.1 million). As such, net cash plus receivables was flat across the period.
Jonathan Copus, Getech CEO, commented:
“We continue to work in a volatile investment environment, targeting customer budgets set 12 months or more previous. It is therefore encouraging to have expanded H1 sales, particularly since this has been driven by a significant and growing number of our customers signing-up to multi-year sales agreements. These commitments speak to the practical value that our customers find in our product and service offering, which in turn strengthens Getech’s pipeline of recurring revenue.”
* Cost base is measured as: cost of sales, administrative costs and development costs capitalised, less depreciation and amortisation, and adjusted for movement in inventories, foreign exchange and non-cash provisions. These are Getech’s cash costs.
————————————————————————————————————
So cash has dropped by £0.4m during H2 2018, and receivables have advanced by £0.4m.
I get the impression the business operated at an accounting break-even performance, with the cash movement due to an increase to outstanding customer payments.
Maynard
Getech (GTC)
Director General to Consult with Investors
No, I had no idea what the title meant either. Turns out this RNS is about the Sierra Leone licensing project. Here is the full text:
———————————————————————————————————————————
In August 2018 Mr Timothy Kabba was appointed as Director General of the Sierra Leone Petroleum Directorate. Mr Kabba brings fresh perspectives to the current Fourth Sierra Leone Licensing Round and in step with the Government’s New Direction initiative, he has decided to expand the dialogue and enter a period of industry consultation.
This consultation process is expected to last for up to 6 months and requires the temporary suspension of the ongoing Fourth Licensing Round.
Mr. Timothy Kabba, Director General of the Sierra Leone Petroleum Directorate commented:
“The Republic of Sierra Leone is committed to attracting long-term investment through the development of its natural resources. The Petroleum Directorate’s mission is to deliver this investment through a process that creates maximum value for both the investor and the country’s people. I look forward to meeting with the industry during this important consultation process”
Jonathan Copus, CEO of the Getech Group commented:
“The offshore waters of Sierra Leone contain proven petroleum systems and the country’s Fourth Licensing Round has generated significant levels of interest. This has led to a busy and wide-ranging dialogue with a variety of high-quality international oil and gas companies. Through a process of consultation, the staff of the Petroleum Directorate and Getech will work in partnership to narrow and focus the License Round conversation – the shared goal being the successful conclusion of that Round.”
———————————————————————————————————————————
Back in May the Sierra Leone schedule was extended by three months.
And now we have a further delay of up to six months.
The Sierra Leone project is important because GTC had said the following within its February annual results:
“Net of our revenue sharing agreement with the Sierra Leone Government, a single licensing of this dataset has the potential to be a disclosable event for the Getech Group.”
I am not entirely sure, but I would guess the oil firm that takes on the licence is likely to pay for the GTC dataset that is currently available to view at the three data rooms.
The PDSL website has some informative background information on this licensing round.
Maynard