20 November 2017
By Maynard Paton
Update on Record (REC).
Event: Interim results and shareholder presentation for the six months to 30 September 2017 published 17 November 2017
Summary: This was another frustrating RNS from the specialist currency manager. The cost base has ‘inevitably’ increased, yet revenue and client numbers remain stagnant and — as usual — there’s no real sign of the business enjoying an upturn anytime soon. At least REC continues to generate cash, retains a robust cash pile and distributes a healthy dividend. The yield is 5%, which is not too bad in the current market. I continue to hold.
Price: 46p
Shares in issue: 199,054,325
Market capitalisation: £92m
Click here to read all my REC posts
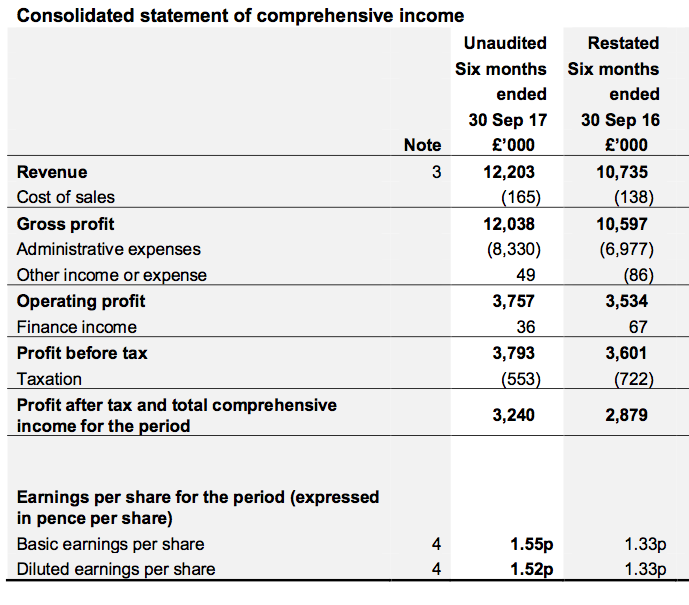
Results:
My thoughts:
* The lack of fresh client mandates alongside the growing cost base remains very frustrating
REC’s quarterly updates (Q1 and Q2) had already indicated these results would be a somewhat humdrum affair.
The updates had informed investors that effective client assets under management (AUMe) had bobbed around the $60bn/£46bn mark for six months, which left my sums predicting annual revenue running at £24m… and therefore half-year revenue at the actual £12m.
REC said first-half revenue and operating profit had gained 14% and 6% respectively on the comparable period of the year before.
However, that comparable period enjoyed only three months of a post-Brexit GBP, which has since boosted REC’s finances as the group’s revenue is predominantly paid in the now stronger USD.
A comparison with the preceding second half is more informative:
| H1 2017 | H2 2017 | H1 2018 | ||
| Revenue (£k) | 11,080 | 12,848 | 12,203 | |
| Operating profit (£k) | 3,534 | 4,210 | 3,757 |
Here we see the latest H1 showing revenue down 5% and operating profit down 11% when compared to H2. It appears the growing cost base I mentioned when I studied June’s annual statement has started to emerge (see below).
REC’s typically long-winded narrative yielded very little on the prospect of the group winning new clients. The number of customers stayed at 59 during the six months and has increased by a net four since March 2015.
REC’s ten largest clients produced 76% of revenue during the half, and this client concentration — alongside the lack of fresh mandates and the growing cost base — remains very frustrating.
* “Such costs are an inevitable part of ensuring our continued innovation”
I included this chart within my June write-up:
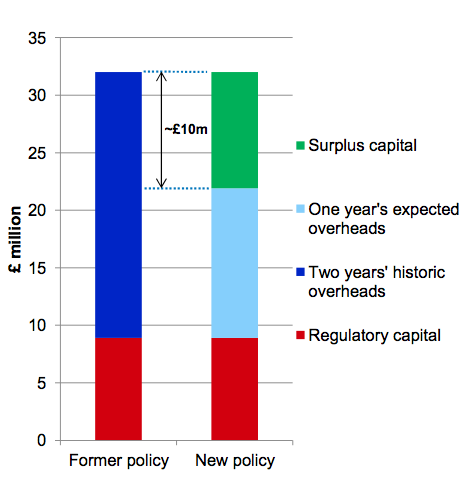
I wrote at the time:
“Squinting at the chart above, it appears one year’s expected overheads now come to £13m. Given REC said overheads for 2017 were £11.7m, I am disappointed additional costs still seem to be creeping into the business.”
My £13m overhead guess appears to have been confirmed.
Here is an extract from the H1 statement concerning costs:
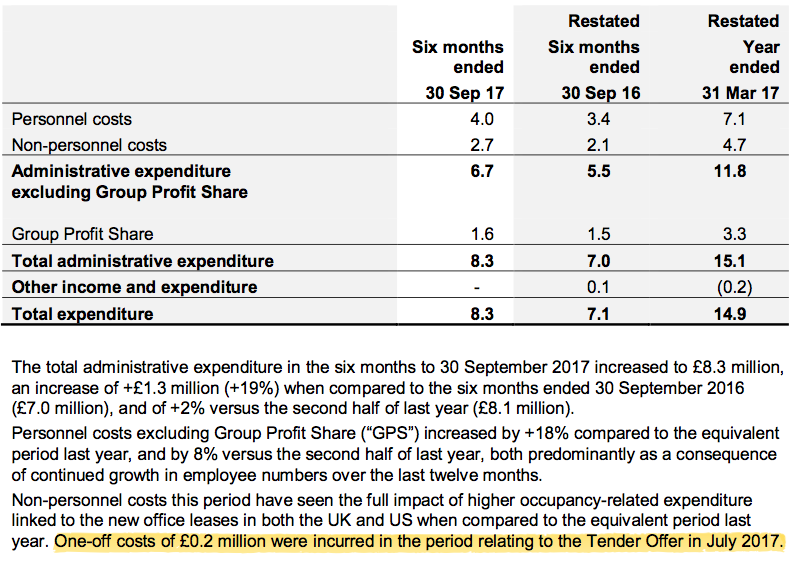
Personnel costs of £4m plus non-personnel costs of £2.5m (i.e. the stated £2.7m less the £0.2m tender-offer costs) give £6.5m for the half-year and £13m for a full year.
The costs are apparently inevitable (my bold):
“Additional resources required in operational, research and client-facing areas of the business have contributed to an increase in costs. Such costs are an inevitable part of ensuring our continued innovation and in maintaining the very highest levels of service for our clients in the longer-term.”
I just wish REC could inevitably expand its customer base and revenue to cover these inevitable extra charges.
(I should add that REC’s H1 operating margin was still a robust 31%, so perhaps it is unrealistic of me to expect further margin improvements.)
* I should have known they’d soon under-perform
REC’s low-margin Passive Hedging category retained its position as the group’s largest source of fees:
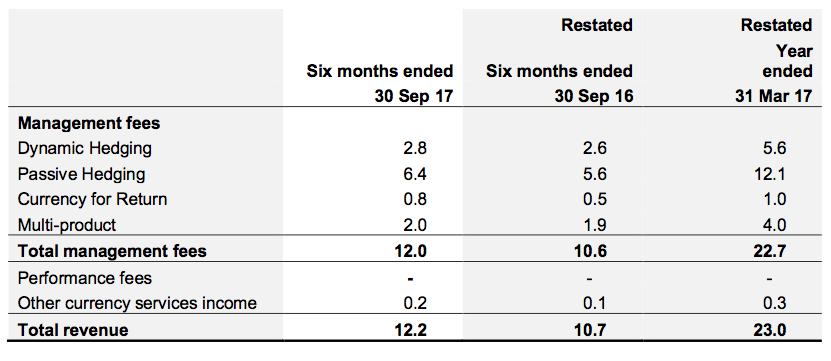
REC published the following fee rates for each of its services:
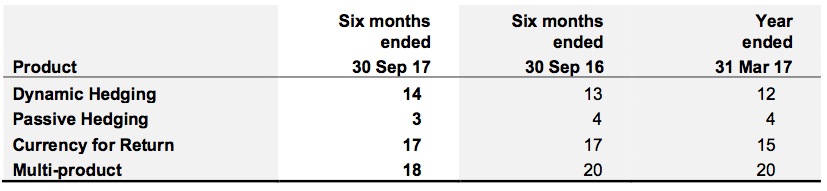
I have calculated the fee rates myself, based on the average AUMe for each product category and the average £1:$1.29 exchange rate seen during the six months:
| 6 months to 30 September 2017 | Average AUMe ($m) | Management fee (£k) | Fee rate (bps) |
| Currency for Return | 1,350 | 826 | 15.8 |
| Dynamic Hedging | 5,400 | 2,801 | 13.4 |
| Passive Hedging | 49,950 | 6,400 | 3.3 |
| Multi-product | 2,750 | 1,927 | 18.1 |
| Cash and other | 250 | 0 | 0.0 |
| TOTAL | 59,700 | 11,954 | - |
The differences may look small when compared to REC’s own figures, but they can create a sizeable effect on REC’s possible earnings.
Also, having trumpeted the fact that all of REC’s profit-seeking strategies had performed well during 2017, I should have known they’d soon be due a reversal:
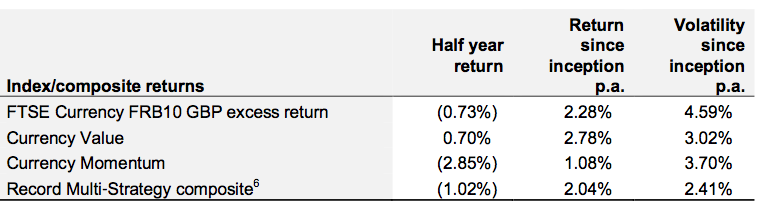
At least the strategies are showing positive returns since their respective inceptions. But whether the size of those long-term returns — at less than 3% — can encourage new clients to sign up is another matter entirely.
* The underlying full-year dividend may advance only 5%
REC’s cash flow was impressive once again.
Little in the way of capital expenditure and working-capital movements meant the £3.7m operating profit was translated fully into cash and supported the payment of last year’s £2m special dividend.
REC’s total cash position dropped by almost £11m to £26.3m following the £10m tender offer during July.
Factor in regulatory capital of £8.9m and third-party investments of £4.8m, and I reckon ‘surplus’ cash could be £12.6m or 6.4p per share. The balance sheet continues to carry no debt and no pension obligations.
REC announced an H1 dividend of 1.15p per share, up 39% on the 0.825p per share declared for H1 last year.
However, July’s £10m tender offer reduced the share count by 9% and on a total cash-paid basis, the H1 payout advanced from £1.8m to £2.3m or 28%.
Note also that REC’s final dividend is likely to equal this £2.3m H1 payout (my bold):
“Changes were announced in the 2017 Annual Report in terms of the Board’s intention to pursue a progressive dividend policy, with dividends expected to be paid equally in respect of interim and final, subject to the financial performance of the business, the market conditions at the time and any excess capital assessed as required under the Group’s capital policy.”
As such, the 2018 full-year dividend could be £4.6m — just 5% ahead of the £4.4m paid as ordinary dividends for 2017.
At least further special dividends could be declared (my bold):
“Also as previously stated, the Board will also give consideration to returning at least part of any excess of current year earnings per share over ordinary dividends to shareholders, potentially in the form of special dividends, subject to the financial performance of the Group for the full year, the market conditions at the time and any increased capital requirements.”
Valuation
Using my own fee-rate calculations and the latest AUMe numbers, I reckon potential management fees could now be running at £23.7m with £1 buying $1.32:
| Year to 30 September 2018 (est) | AUMe ($m) | Fee rate (bps) | Management fee (£k) |
| Currency for Return | 1,700 | 15.8 | 2,035 |
| Dynamic Hedging | 4,500 | 13.4 | 4,568 |
| Passive Hedging | 51,700 | 3.3 | 12,925 |
| Multi-product | 3,000 | 18.1 | 4,114 |
| Cash and other | 300 | 0.0 | 0 |
| TOTAL | 23,642 |
Overheads of £13m and the 30% employee profit share give a possible operating profit of £7.4m:
| Year to 30 September 2018 (est) | |
| Management fees (£k) | 23,642 |
| Less expected staff costs (£k) | (8,000) |
| Less expected other costs (£k) | (5,000) |
| Less 30% profit share (£k) | (3,193) |
| Operating and pre-tax profit (£k) | 7,449 |
After standard 19% tax, my new sums suggest earnings could be £6.0m or 3.03p per share.
The P/E at 46p could therefore be about 15. Adjust for the ‘surplus’ cash and the rating drops to about 13.
The highlight of this stock remains the yield, which is 5% using the anticipated 2.3p per share ordinary dividend.
Maynard Paton
Disclosure: Maynard owns shares in Record.

Record (REC)
Q3 Trading Update:
This update extended the run of quarterly statements that did not reveal any significant progress.
Total effective client assets under management (AUMe) advanced by $2.7bn to $63.9bn during the 3 months to 31 December 2017, and in sterling terms gained £1.7bn to £47.3bn.
This Q3 update stated:
“This quarter saw further growth in AUME and in client numbers, with growth in particular from existing client mandates as well as new business.”
To put the “growth” of “new business” into perspective, client numbers increased by one to 60 during the quarter. The additional AUMe was almost entirely Passive Hedging money, which is REC’s lowest margin earner.
Still, at least this Q3 statement did not own up to mandate losses. The last two quarterly updates had seen notable withdrawals.
The update gave the same old weary outlook of ‘engaging with clients’:
“Volatility in currency markets linked to political and economic uncertainty continues to create opportunities for engagement with existing and potential clients on risk management, return-seeking and combined strategies. We remain confident of making further progress in the rest of the financial year and through to the next financial year.”
Just when ‘engaging with clients’ will actually translate into decisively adding new clients with sizeable high-margin mandates remains anyone’s guess at present.
One bit of good news appears to be the backtracking of certain regulatory changes:
“A busy quarter included final preparations for new regulatory requirements under EMIR and MiFID II. The reversal by European regulators of the imposition of mandatory variation margin achieved the outcome which Record had long advocated, even though significant resources had been committed in the meantime to preparing for the change. The scope of the MiFID II changes was substantial, requiring significant resources and system enhancements and it’s pleasing to note that Record achieved full operational readiness by the 3rd January 2018 deadline.”
I have adjusted my valuation sums for the revised AUMe and, assuming fee rates remain the same as those noted in the Blog post above, and using £1:$1.39, then:
* Currency for Return AUMe of $1.7bn gives fees of £1,932k;
* Dynamic Hedging AUMe of $4.5bn gives fees of £4,228k;
* Passive Hedging AUMe of $51.7bn gives fees of £12,891k;
* Multi-product AUMe of $3.0bn gives fees of £4,037k;
* Total fees = £23,199k
Less my guesses of £8,000k for staff costs and £5,000k for other costs as noted in the Blog post above, then less the 30% profit share (of £3,060k), I arrive at an operating profit of £7,139k. Taxed at 19% gives earnings of £5,783k or 2.91p per share.
Three months ago I was predicting earnings of 3.24p per share. The 10% earnings guess reduction is due to the stronger GBP and the extra costs the intervening H1 results revealed (see the Blog post above).
With the share price at 43p, my P/E comes to 14.8.
REC’s ‘surplus’ net cash position — i.e. cash excluding regulatory capital and third-party investments — is close to £13m or 6.4p per share. My P/E adjusted for this ‘surplus’ cash is 12.6.
At least my 2.91p per share guess covers REC’s indicative 2.3p per share ordinary dividend, which supports a 5.3% income at 43p.
As my Blog post above noted, REC has said:
“…[T]he Board will also give consideration to returning at least part of any excess of current year earnings per share over ordinary dividends to shareholders, potentially in the form of special dividends, subject to the financial performance of the Group for the full year, the market conditions at the time and any increased capital requirements.”
So with my 2.91p per share earnings prediction exceeding REC’s indicative 2.3p per share dividend, there is some hope that a special dividend will be forthcoming.
Maynard